Traffic Overview Dashboard
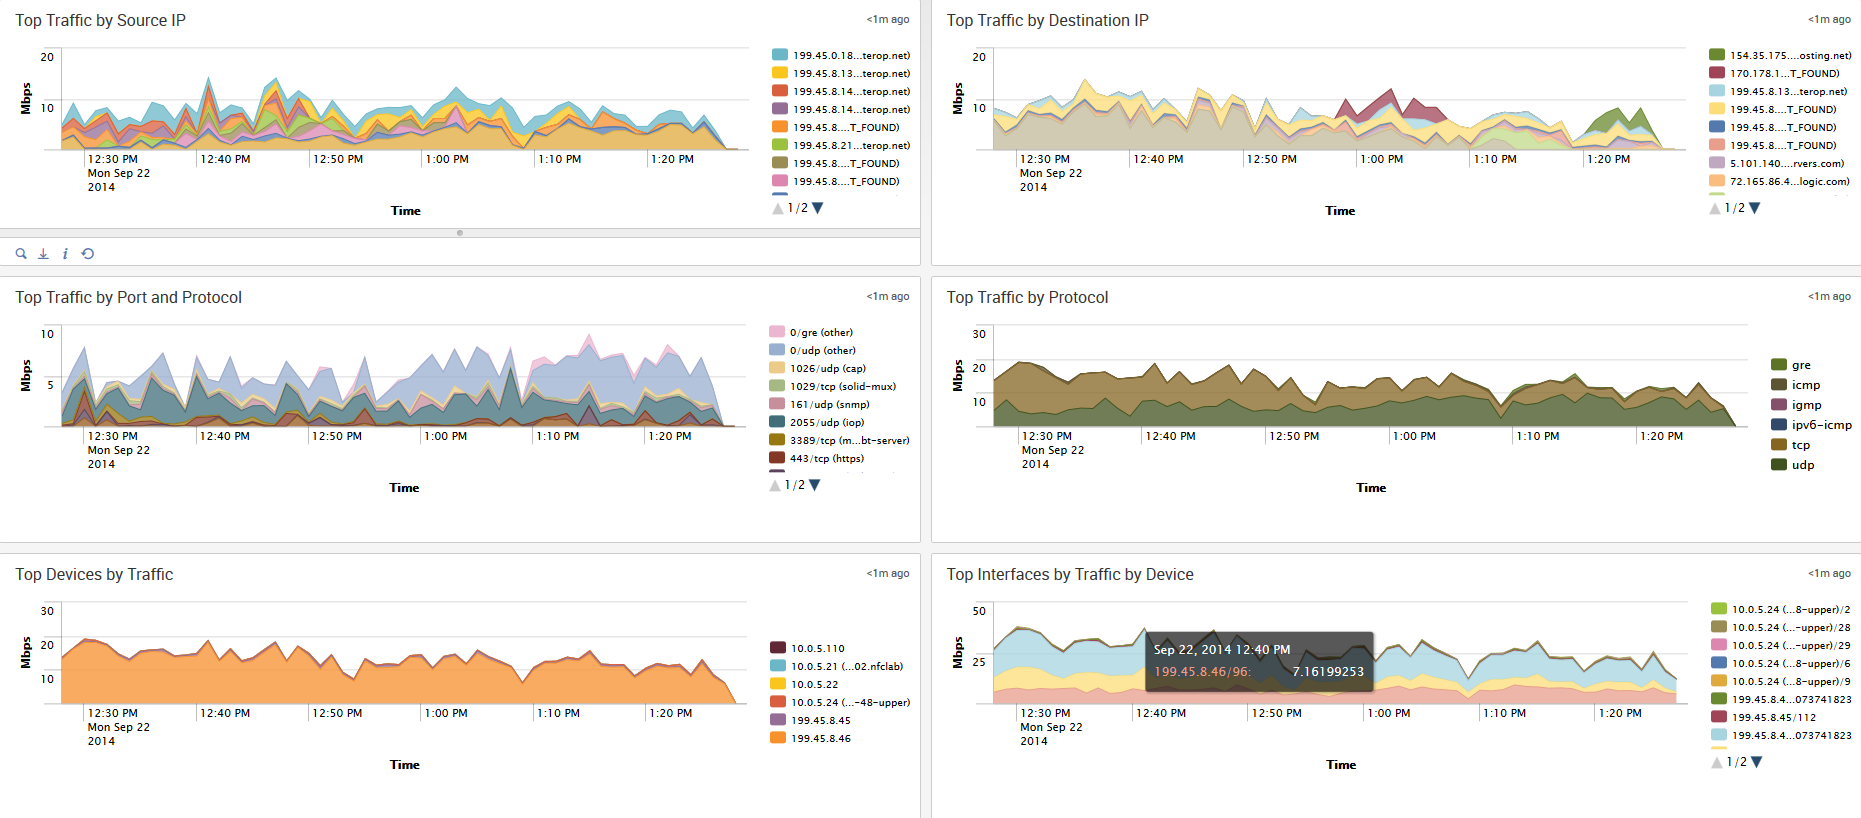
The Traffic Overview dashboard is the top view, aimed to provide a summary on traffic over a time period. The views can be filtered by the NFO Hostnames, Device Group, Device and Time Range.
The panels show Top Traffic by Source IP, Top Traffic by Destination IP, Top Traffic by Protocol and Port, Top Traffic by Protocol, Top Devices by Traffic, Top Interfaces by Traffic by Device.
Use pan-and-zoom to select desired time range and click on the panel header to drilldown to the appropriate dashboard for further searching and filtering.