SNMP and NetFlow Data Monitoring Content Pack for ITSI
Introduction
In IT environments, many critical issues stem from factors beyond the application stack, often originating within network devices, among other components. This document, focused on Network Devices, offers comprehensive insights and methods for mapping these dependencies within Splunk IT Service Intelligence (ITSI).
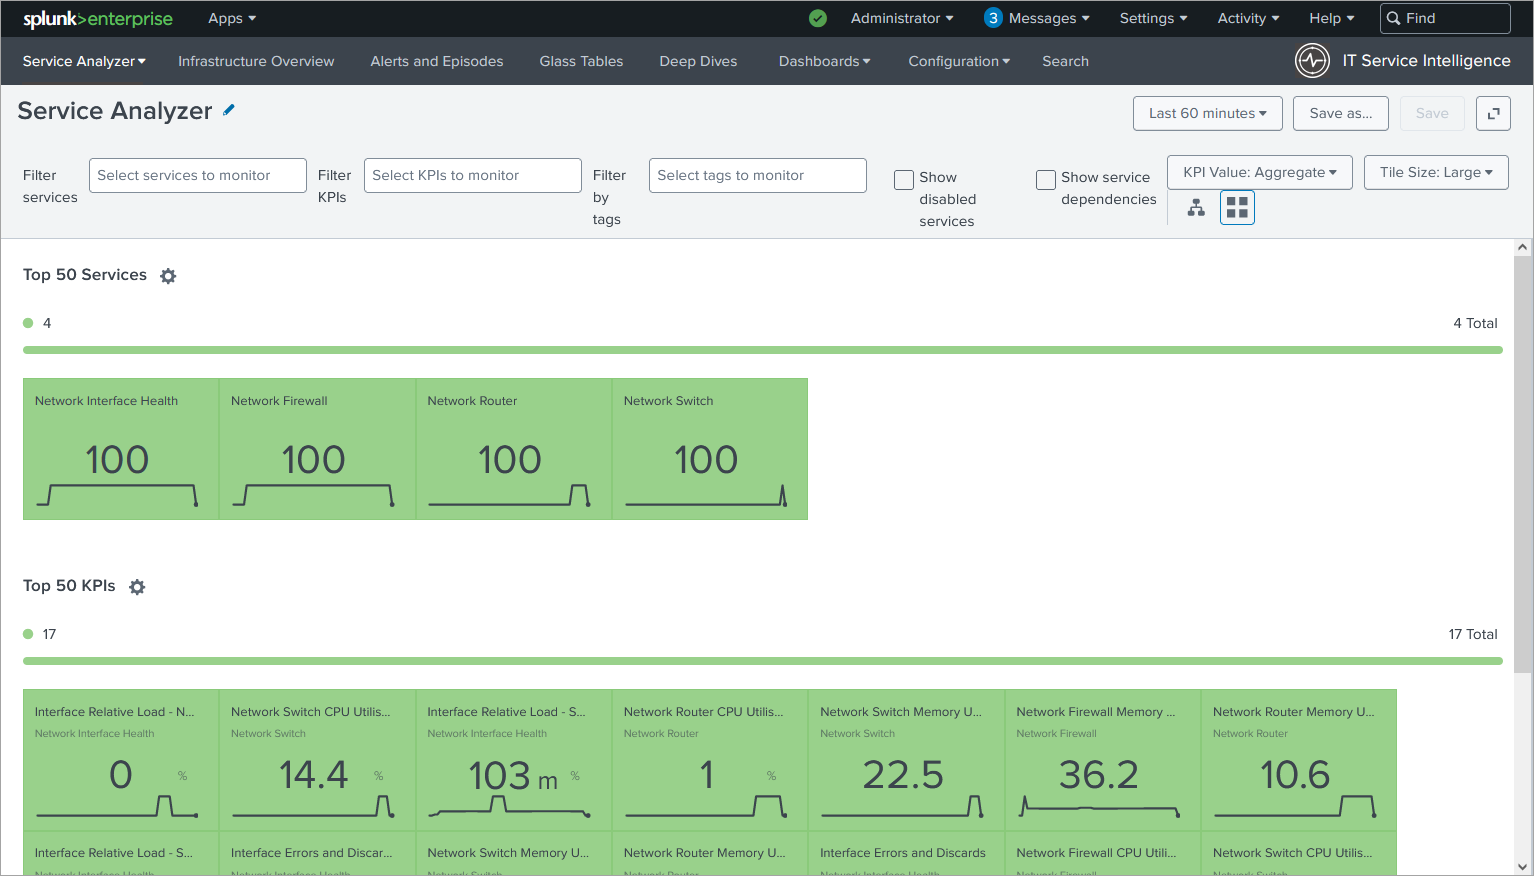
The image below displays all the services contained in the content pack, showcased within the Service Analyzer:
Leveraging Macros, Transforms, and Saved Searches
The Content Pack utilizes macros, transforms, and saved searches to simplify network data management within ITSI. This streamlines the discovery and monitoring process, allowing you to focus on gaining valuable insights from your network data.
The image below displays the new Entity types introduced in this Content pack.

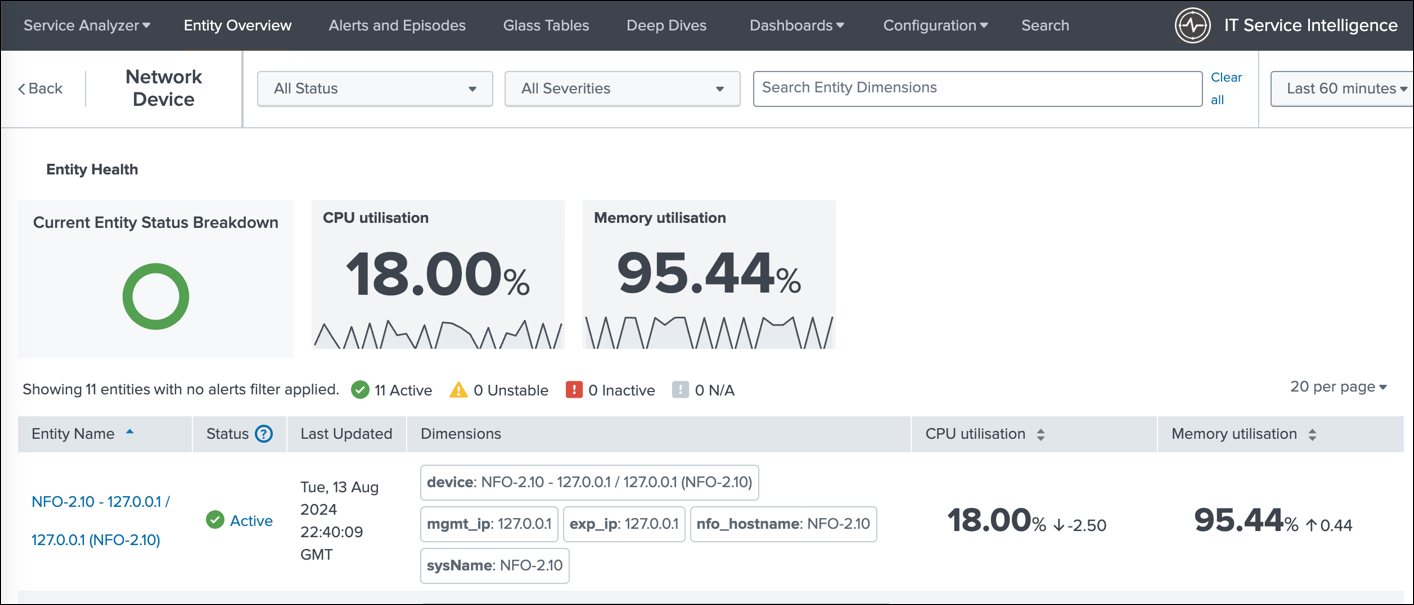
The next image showcases the list of entities displayed when you select a specific entity type (e.g., Network Devices). This allows you to easily navigate and manage your network devices within ITSI.
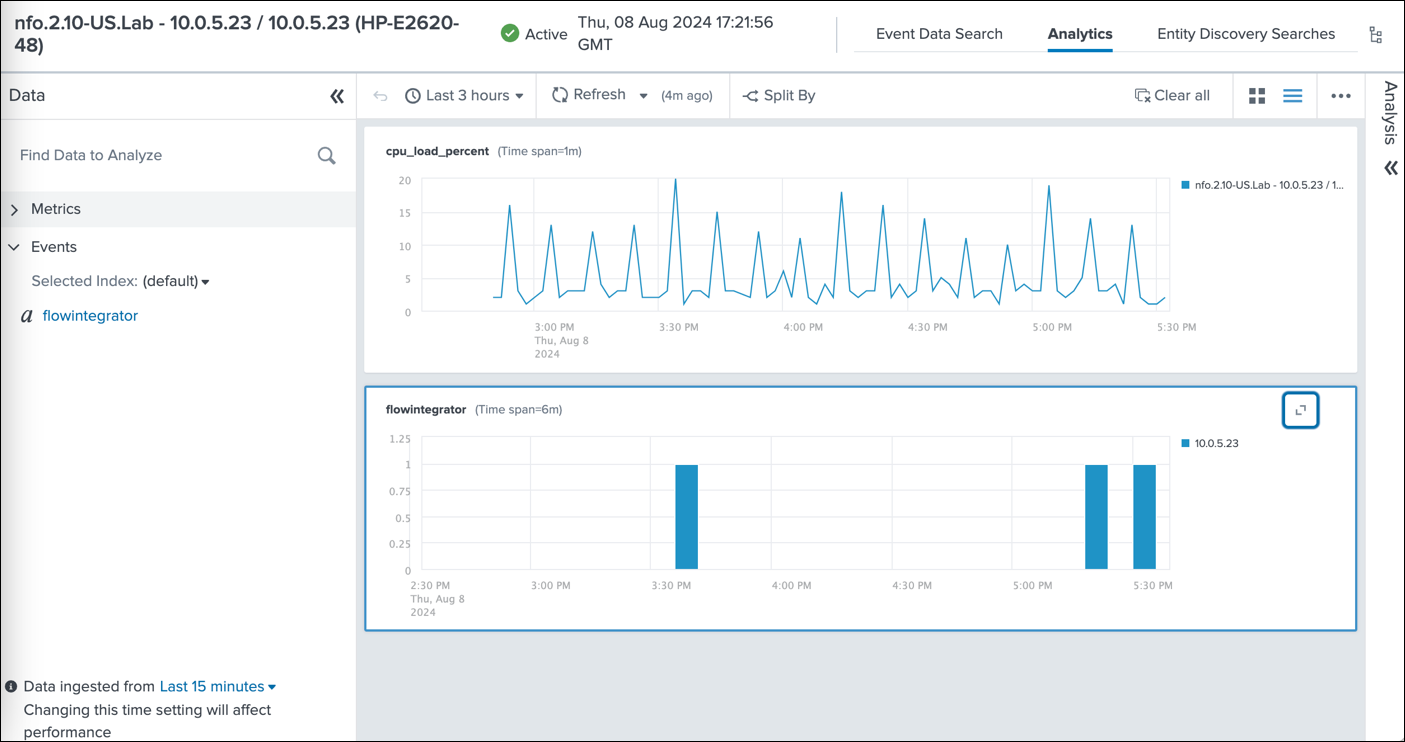
This image displays the stacked dashboard showing the CPU load and SNMP trap events, enabling you to correlate CPU performance with network alerts and identify potential root causes for performance issues.
This image showcases the review of SNMP trap events in the Analytics dashboard.
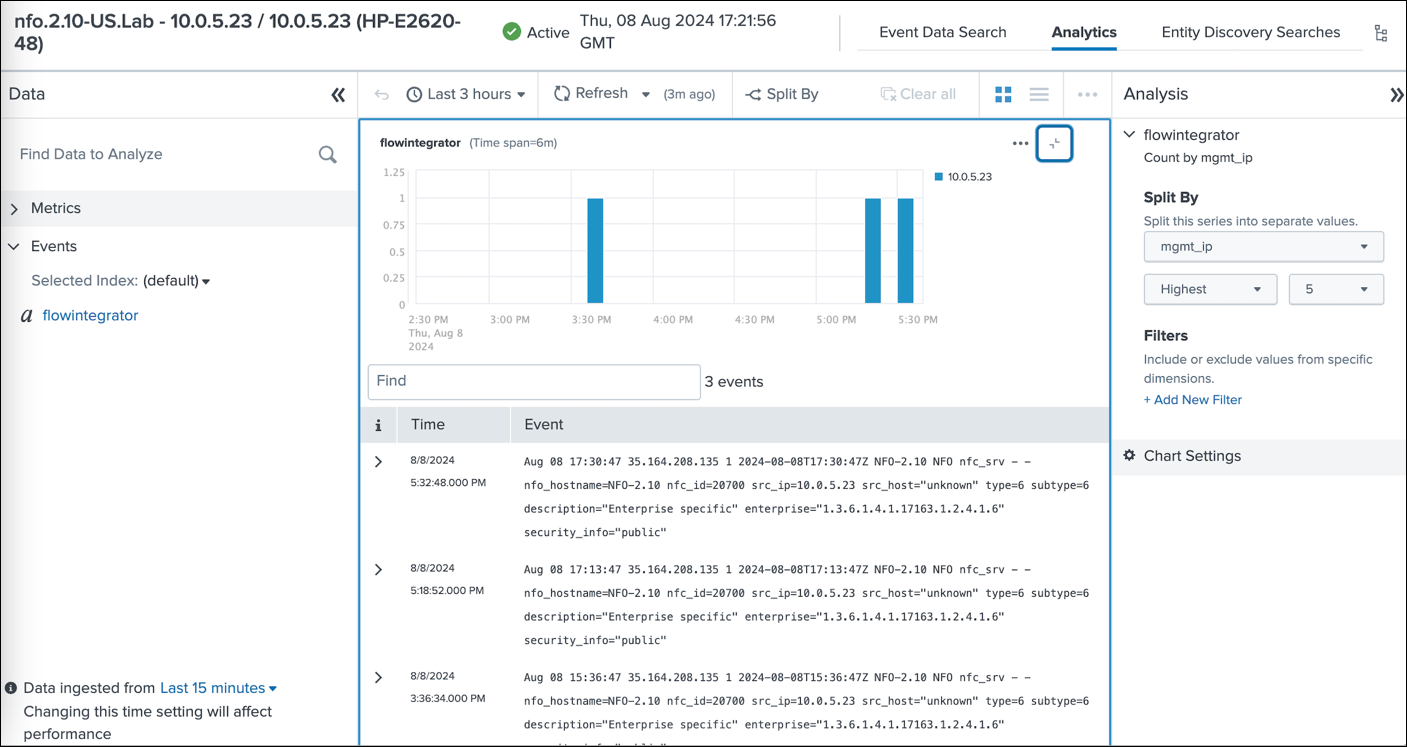
This empowers you to analyze performance metrics, identify potential network issues, and gain valuable insights into your network health.
The following section provides detailed instructions for the installation and configuration of the 'SNMP and NetFlow Data Monitoring Content Pack for ITSI.' This Pack relies on SNMP polling and optionaly NetFlow data sent to Splunk by NetFlow Optimizer (NFO).
This content pack includes:
- Entity Types
- KPI base searches
- Service templates
- Services
Entity Types
There are two Entity Types:
- Network Device: his type is intended for grouping entities that serve as network devices, such as routers, switches, firewalls, and more
- Network Interface: This type is used to categorize entities that represent interfaces on network devices
KPI Base Searches
The content pack includes searches for data in both the events index and the metrics index.
Data in Events Index
- Network Device CPU Utilization: This metric, used by Network Device-related services, displays the device's CPU utilization as a percentage. The data is obtained through SNMP queries (nfc_id=20103).
- Network Device Memory Utilization: Utilized by Network Device-related services, this metric indicates the percentage of memory utilization on the device. The data is gathered via SNMP queries (nfc_id=20103).
- Interface Errors and Discards: Employed by the Network Interface Health service, this metric showcases the percentage of errors and discards in relation to all transmitted and received packets on the interface. The data is collected through SNMP queries (nfc_id=20103).
- Interface Relative Load – SNMP: Utilized by the Network Interface Health service, this metric demonstrates the percentage of current traffic on the interface compared to its speed. Interface speed and current traffic is determined through SNMP queries (nfc_id=20103).
Data in Metrics Index
- Network Device CPU Utilization Metrics: This metric, used by Network Device-related services, displays the device's CPU utilization as a percentage. The data is acquired through SNMP queries (nfc_id=20103).
- Network Device Memory Utilization Metrics: Utilized by Network Device-related services, this metric indicates the percentage of memory utilization on the device. The data is gathered via SNMP queries (nfc_id=20103).
- Interface Errors and Discards Metrics: Employed by the Network Interface Health service, this metric showcases the percentage of errors and discards in relation to all transmitted and received packets on the interface. The data is collected through SNMP queries (nfc_id=20103).
- Interface Relative Load – SNMP polling based Metrics: Utilized by the Network Interface Health service, this metric demonstrates the percentage of current traffic on the interface compared to its speed. Interface speed and current traffic is determined through SNMP queries (nfc_id=20103).
Service Templates
There is one service template: Network Device. This template is intended for the following four services: Network Firewall, Network LoadBalancer, Network Router, and Network Switch. It enables you to define specific KPIs for each device type.
Services
The following services are defined in the Content Pack:
- Network Firewall
- Network LoadBalancer
- Network Router
- Network Switch
- Network Interface Health
The first four services are based on Network Device service template and include the following four KPIs:
- Network Device CPU Utilization
- Network Device CPU Utilization Metrics
- Network Device Memory Utilization
- Network Device Memory Utilization Metrics
The Network Interface Health includes the following four KPIs:
- Interface Errors and Discards
- Interface Errors and Discards Metrics
- Interface Relative Load - SNMP
- Interface Relative Load - SNMP Metrics
Prerequisites
Please be sure to have the following before you begin the installation of the Content Pack:
- NetFlow Optimizer (NFO) is installed in your environment
- SNMP Information Monitor is enabled (for data about interfaces, such as ifName, ifSpeed, etc.)
- SNMP Custom OID Sets Monitor Module is enabled (for SNMP polling of CPU and Memory utilization)
- NFO output is configured to send data to Splunk event index or metrics index
- Technology Add-On for NetFlow (TA-netflow) (https://splunkbase.splunk.com/app/1838/) installed on your Splunk Search Heads, Indexers, and Heavy Forwarders
The Content Pack relies on the following:
-
The data from SNMP polling, and optionally NetFlow data, is ingested into Splunk, either in the event index as defined by the
nfo_netflow_index macroor in the metrics index as defined by thenfo_netflow_index_metricsmacro. Both macros are provided within the Content Pack. -
The following fields are expected in SNMP polling events (nfc_id=20103):
- sysName
- exp_ip
- nfo_hostname
- mgmt_ip
- cpu_load_percent
- mem_used_percent
- mem_used
- mem_free
- mem_total
- ifName
- ifIndex
- ifInErrors
- ifOutErrors
- ifInDiscards
- ifOutDiscards
- ifInUcastPkts
- ifOutUcastPkts
- ifInNUcastPkts
- ifOutNUcastPkts
- ifHCInOctets
- ifHCOutOctets
- ifHighSpeed
For memory utilization you may need either mem_used_percent or any two of the following OIDs: mem_used, mem_free, or mem_total
Installation and Configuration Steps
In this section, you'll find the step-by-step installation and configuration instructions.
1. Install the Content Pack into Splunk environment
Install the Content Pack in a single-instance Splunk Enterprise deployment
-
Download the Content Pack by clicking on the following link: https://splunk-netflow.s3.us-west-2.amazonaws.com/itsi-cp/DA-ITSI-CP-CUST-64e79cc8cadcb104d97b7703_1_0_9.tar.gz
-
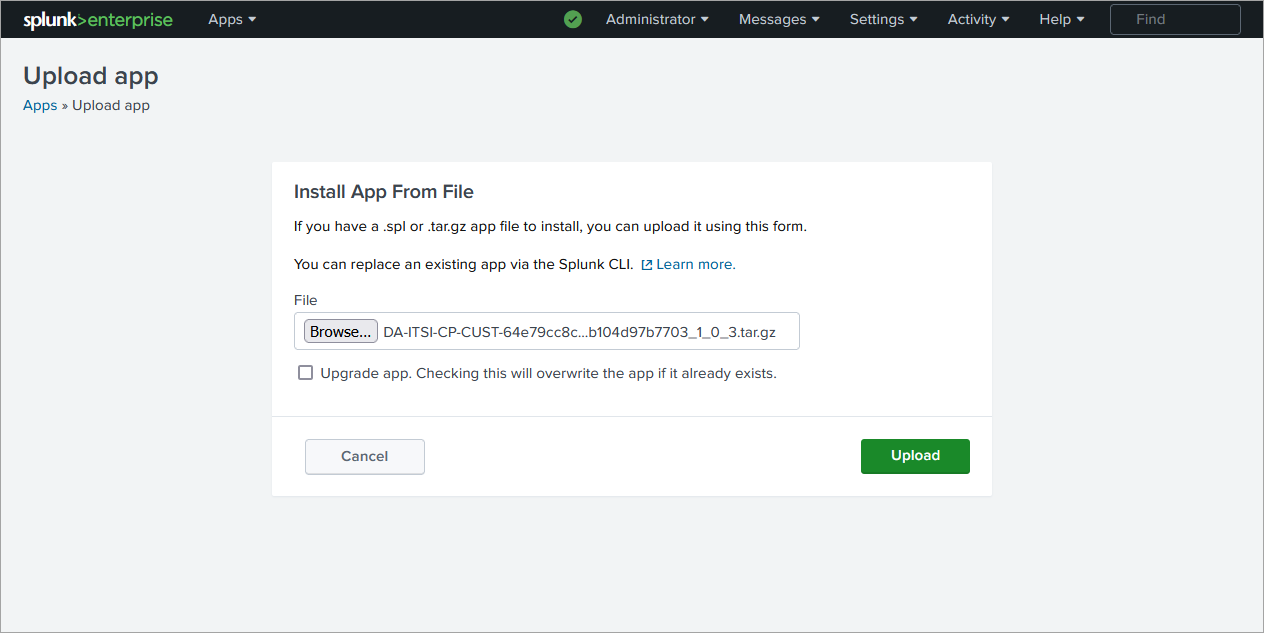
From the Splunk Web home screen, click the gear icon next to Apps
-
Click Install app from file
Install the Content Pack in a distributed Splunk Enterprise deployment
The Content Pack should be installed both on indexers and searchheads.
To install Conetent Pack in a distributed Splunk Enterprise deployment, follow these instructions:
https://docs.splunk.com/Documentation/AddOns/released/Overview/Distributedinstall
Install the Content Pack in Splunk Cloud Platform
To install Conetent Pack in Splunk Cloud Platform, follow these instructions:
https://docs.splunk.com/Documentation/AddOns/released/Overview/SplunkCloudinstall
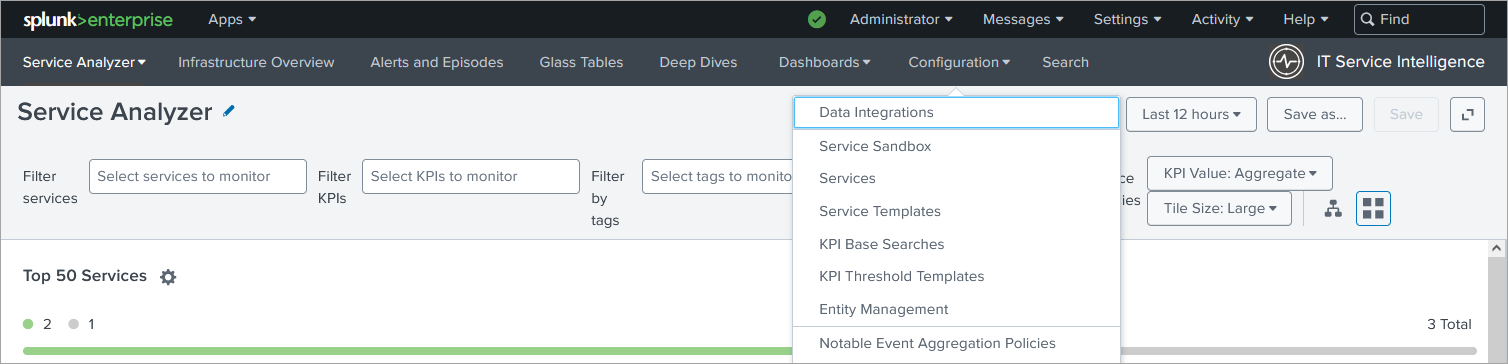
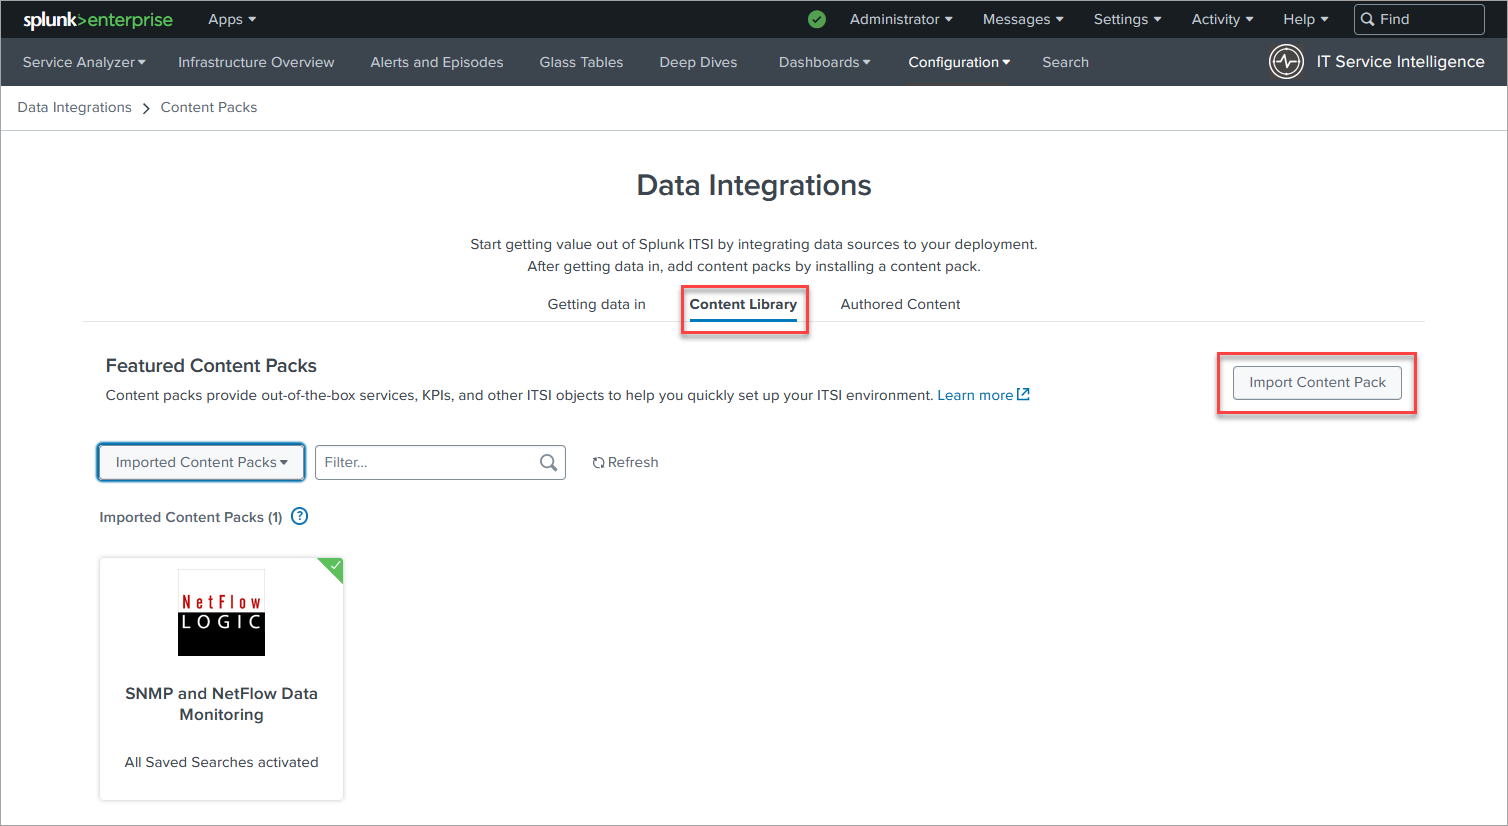
2. Import the Content Pack
In ITSI app go to Configuration>Data Integrations>Content Library and import the new Content Pack
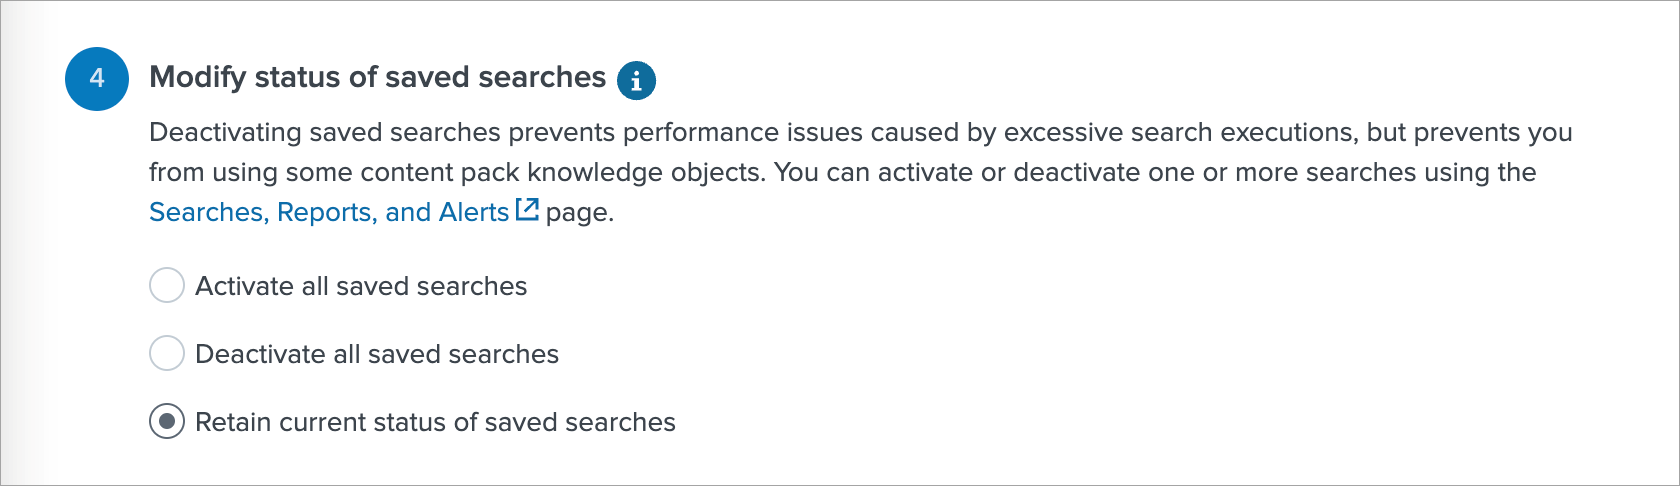
On the next page in section 4 select the Retain current status of saved searches. Later this will enable you to choose what saved search to use to import Entities.
3. Configure Index
- If you are using events based index:
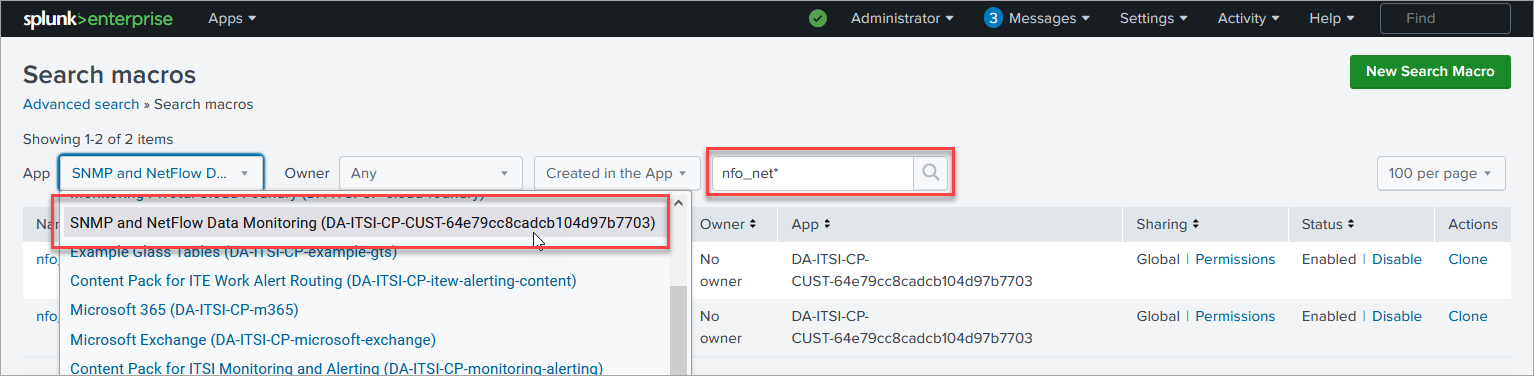
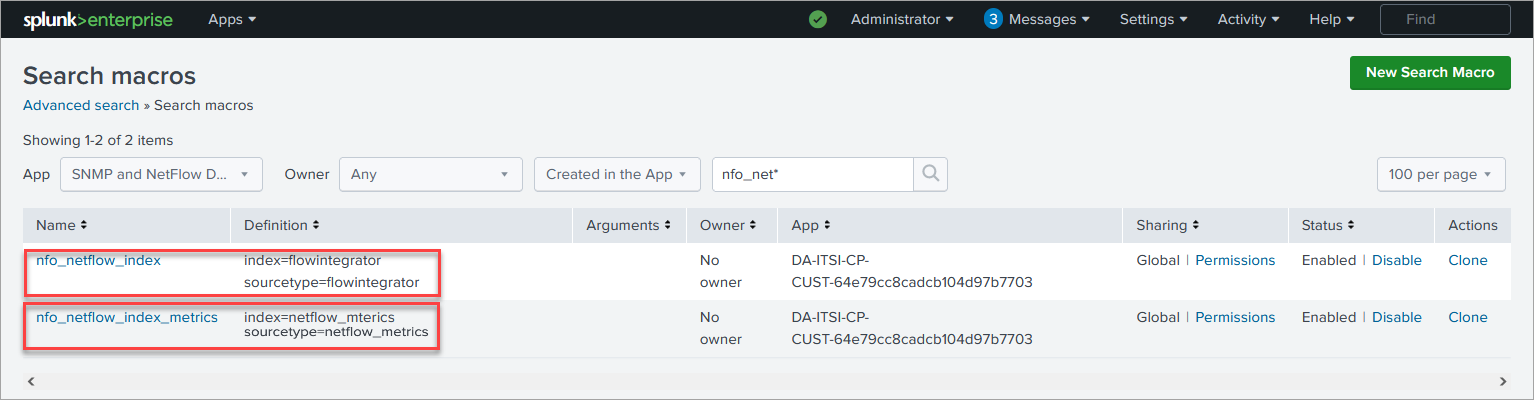
In Settings->Advanced search->Search macros find
nfo_netflow_indexmacro and change it to point to your events index - If you are using metrics based index:
In Settings->Advanced search->Search macros find
nfo_netflow_index_metricsmacro and change it to point to your metrics index
4. Import Network Devices as Entities
In ITSI app go to Configuration>Entity Management and select Entity Discovery Searches tab. In the App dropdown select SNMP and NetFlow Data Monitoring app.
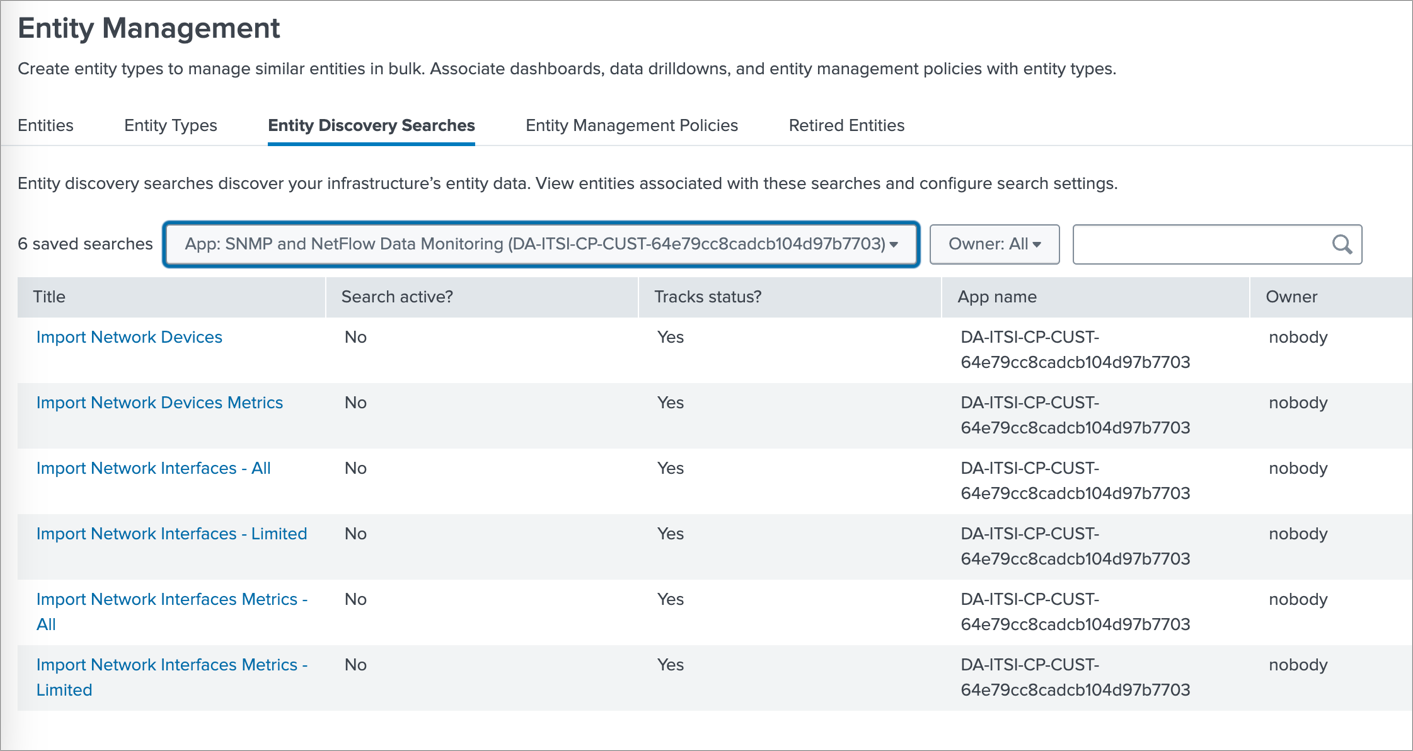
If SNMP data reported by SNMP Custom OID Sets Monitor (nfc_id=20103) is stored in an events based index then click on Import Network Devices, and if it is stored in metrics based index then click on Import Network Devices Metrics.
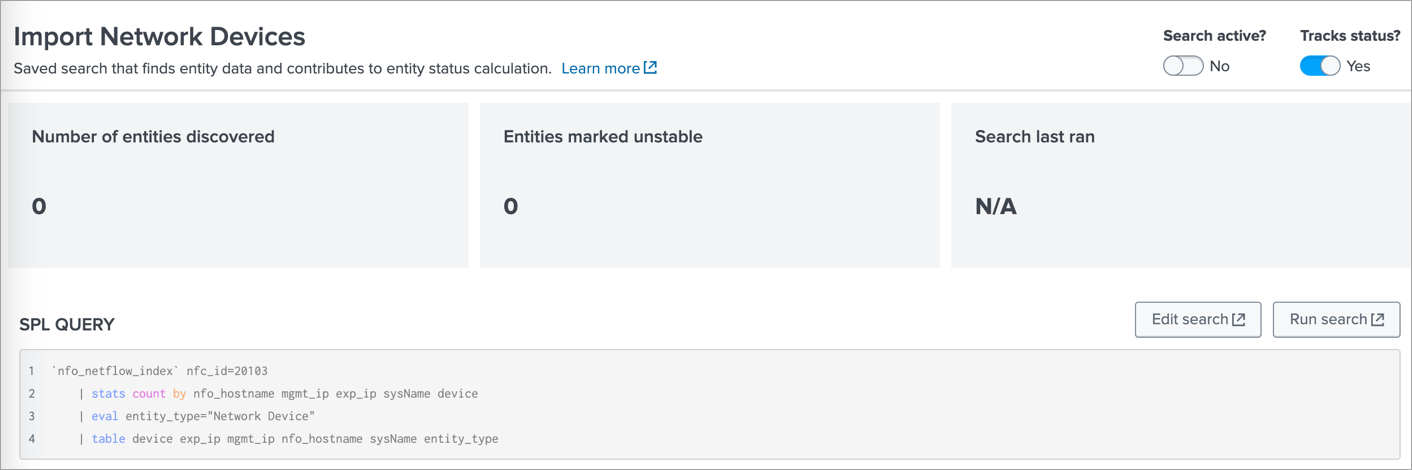
There change the Search active? toggle switch to Yes. This will import the discovered Devices as Entities.
5. Import Network Interfaces as Entities
In ITSI app go to Configuration>Entity Management and select Entity Discovery Searches tab. In the App dropdown select SNMP and NetFlow Data Monitoring app.
There are several options to import Network Interface entities:
- Import Network Interfaces – All
Select this if SNMP data reported by SNMP Custom OID Sets Monitor (nfc_id=20103) is stored in an events based index and you intend to import all detected interfaces. This is not recommended if the number of interfaces is huge, in that case use the next one – “Import Network Interfaces – Limited”
- Import Network Interfaces – Limited
Select this if SNMP data reported by SNMP Custom OID Sets Monitor (nfc_id=20103) is stored in an events based index and you intend to import a selected subset of interfaces. This search applies the critical_interfaces_lookup, where you can specify the list of interfaces to monitor.
Here is an example of critical_interfaces.csv lookup file:
nfo_hostname,"management_ip","snmp_index","comment"
localhost","10.0.3.2",1,"Important interface"
localhost",10.0.5.22,116,"Uplink"
Where:
- nfo_hostname - is the name of NFO host
- management_ip - is the SNMP polling IP address of the device
- snmp_index - is the index of the interface (received from SNMP polling)
- comment - internal comment
- Import Network Interfaces Metrics – All
Select this if SNMP data reported by SNMP Custom OID Sets Monitor (nfc_id=20103) is stored in a metrics based index and you intend to import all detected interfaces. This is not recommended if the number of interfaces is huge, in that case use the next one – “Import Network Interfaces Metrics – Limited”
- Import Network Interfaces Metrics – Limited
Select this if SNMP data reported by SNMP Custom OID Sets Monitor (nfc_id=20103) is stored in a metrics based index and you intend to import a selected subset of interfaces. This search applies the critical_interfaces_lookup, where you can specify the list of interfaces to monitor.
Here is an example of critical_interfaces.csv lookup file:
nfo_hostname,"management_ip","snmp_index","comment"
localhost","10.0.3.2",1,"Important interface"
localhost",10.0.5.22,116,"Uplink"
Where:
- nfo_hostname - is the name of NFO host
- management_ip - is the SNMP polling IP address of the device
- snmp_index - is the index of the interface (received from SNMP polling)
- comment - internal comment
6. Enable Services
Enable one or more Network services and assign entities to them: Configuration>Services.
Available options are:
- Network Firewall
- Network Router
- Network Switch
- Network LoadBalancer
Select one or more Entities based on Entity Title so they would be associated with the selected Service.
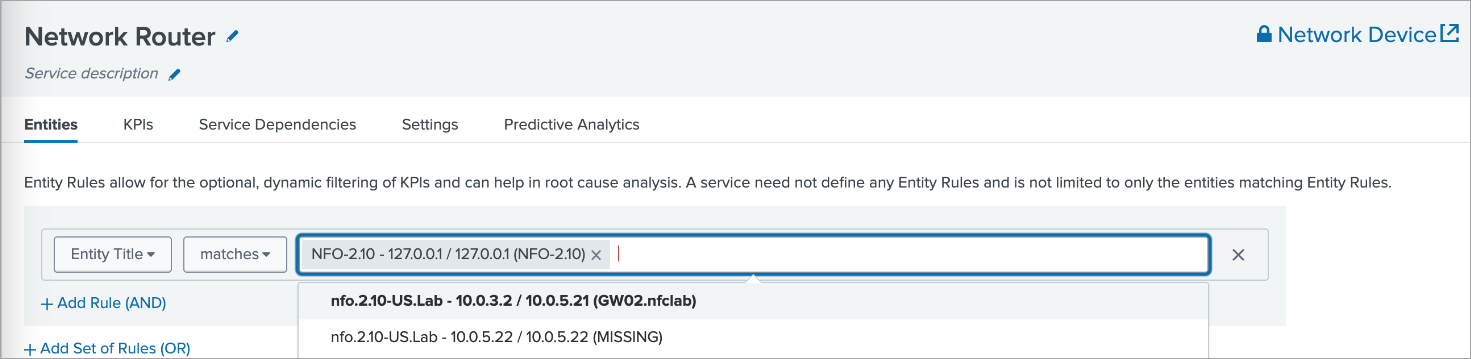
Enable the service when saving it.
7. Enable Network Interface Health Service
Enable Network Interface Health service and assign entities to them:
Go to Configuration>Services>Network Interface Health>Entities.
Receiving SNMP Traps as Universal Alerting in the Content Pack for ITSI Monitoring and Alerting
For more information on Universal Alerting in the Content Pack for ITSI Monitoring and Alerting, visit https://docs.splunk.com/Documentation/CPITSIMonitorAlert/2.3.0/CP/UniversalAlerting.
-
Make sure that you installed TA-netflow v4.5.17 or later
This version has a fix for src field. The link to this TA is: https://splunkbase.splunk.com/app/1838
-
Install the Content Pack for ITSI Monitoring and Alerting
For details, visit https://docs.splunk.com/Documentation/CPITSIMonitorAlert/latest/CP/Install
-
Disable and enable the relevant ITSI components
- Disable all existing ITSI correlation searches, especially if custom-built searches exist for the alert sources that you will normalize. If the searches remain enabled, the resulting Notable Events will be duplicated or otherwise confusing
- Disable all Notable Event Aggregation Policies (NEAPs), especially custom-built policies for the alert sources that you are normalizing. If they remain enabled, the resulting episodes will be duplicated or otherwise confusing
- Later, thoughtfully enable the correlation searches and NEAPs, if they don't overlap with the new Universal components
- Enable the ITSI correlation searches:
- Universal Correlation Search
- Episode Monitoring - Set Episode to Highest Alarm Severity
- Enable the Notable Event Aggregation Policies:
- Episodes by Alarm
- Episodes by Alert Group
- Episodes by ITSI service
- Episodes by src
-
Send SNMP traps to the NFO
Installing and Configuring SNMP Agent and Utilities
The installation and configuration of SNMP Agent and Utilities are optional components that provide additional capabilities to your NetFlow Optimizer setup.
The SNMP Agent is essential for SNMP polling of the host, enabling you to collect valuable data for monitoring CPU and memory utilization. Additionally, SNMP utilities offer useful tools for troubleshooting purposes.
SNMP Agent Installation
- Execute the following command:
- RHEL
- Ubuntu
yum install -y net-snmp
sudo apt-get install snmpd
- Set the SNMP Read-Only Community String as 'public' by adding the line below to the configuration file (/etc/snmp/snmpd.conf):
rocommunity public
- Start the snmpd service:
systemctl enable snmpd && systemctl start snmpd
Allowing SNMP Ports in Firewall
Execute the following commands:
- RHEL
- Ubuntu
firewall-cmd --zone=public --add-port=161/udp --permanent
firewall-cmd --zone=public --add-port=162/udp --permanent
firewall-cmd --reload
sudo ufw allow 161/udp
sudo ufw allow 162/udp
SNMP Utilities Installation
You may want to install SNMP Utilities to test your SNMP polling, e.g. snmpwalk command.
Execute the following command:
- RHEL
- Ubuntu
yum install net-snmp-utils
sudo apt-get install snmp
snmpwalk Examples
$ snmpwalk -v 2c -c public -O e 127.0.0.1  1.3.6.1.2.1.31.1.1.1.1
IF-MIB::ifName.1 = STRING: lo
IF-MIB::ifName.2 = STRING: eth0
$ snmpwalk -v 2c -c public -O e 127.0.0.1  1.3.6.1.2.1.31.1.1.1.15
IF-MIB::ifHighSpeed.1 = Gauge32: 10
IF-MIB::ifHighSpeed.2 = Gauge32: 0
$ snmpwalk -v 2c -c public -O e 127.0.0.1  1.3.6.1.2.1.31.1.1.1.6
IF-MIB::ifHCInOctets.1 = Counter64: 218081865900
IF-MIB::ifHCInOctets.2 = Counter64: 308231409749
$ snmpwalk -v 2c -c public -O e 127.0.0.1  1.3.6.1.2.1.31.1.1.1.10
IF-MIB::ifHCOutOctets.1 = Counter64: 218081872093
IF-MIB::ifHCOutOctets.2 = Counter64: 410216133901