Dashboard Reference Directory
This directory provides a listing of most dashboards included in the NetFlow Analytics for Splunk App. Use this guide to find specialized forensic, operational, and legacy views.
1. Network Conversations (Module 10062)
These dashboards are populated by the NFO Module Network Conversations and provide bidirectional, stitched flow data for comprehensive network analysis.
| Dashboard Description | Click to Zoom |
|---|---|
| Traffic Overview Network Conversations: Unified high-level visibility into traffic and security context. | 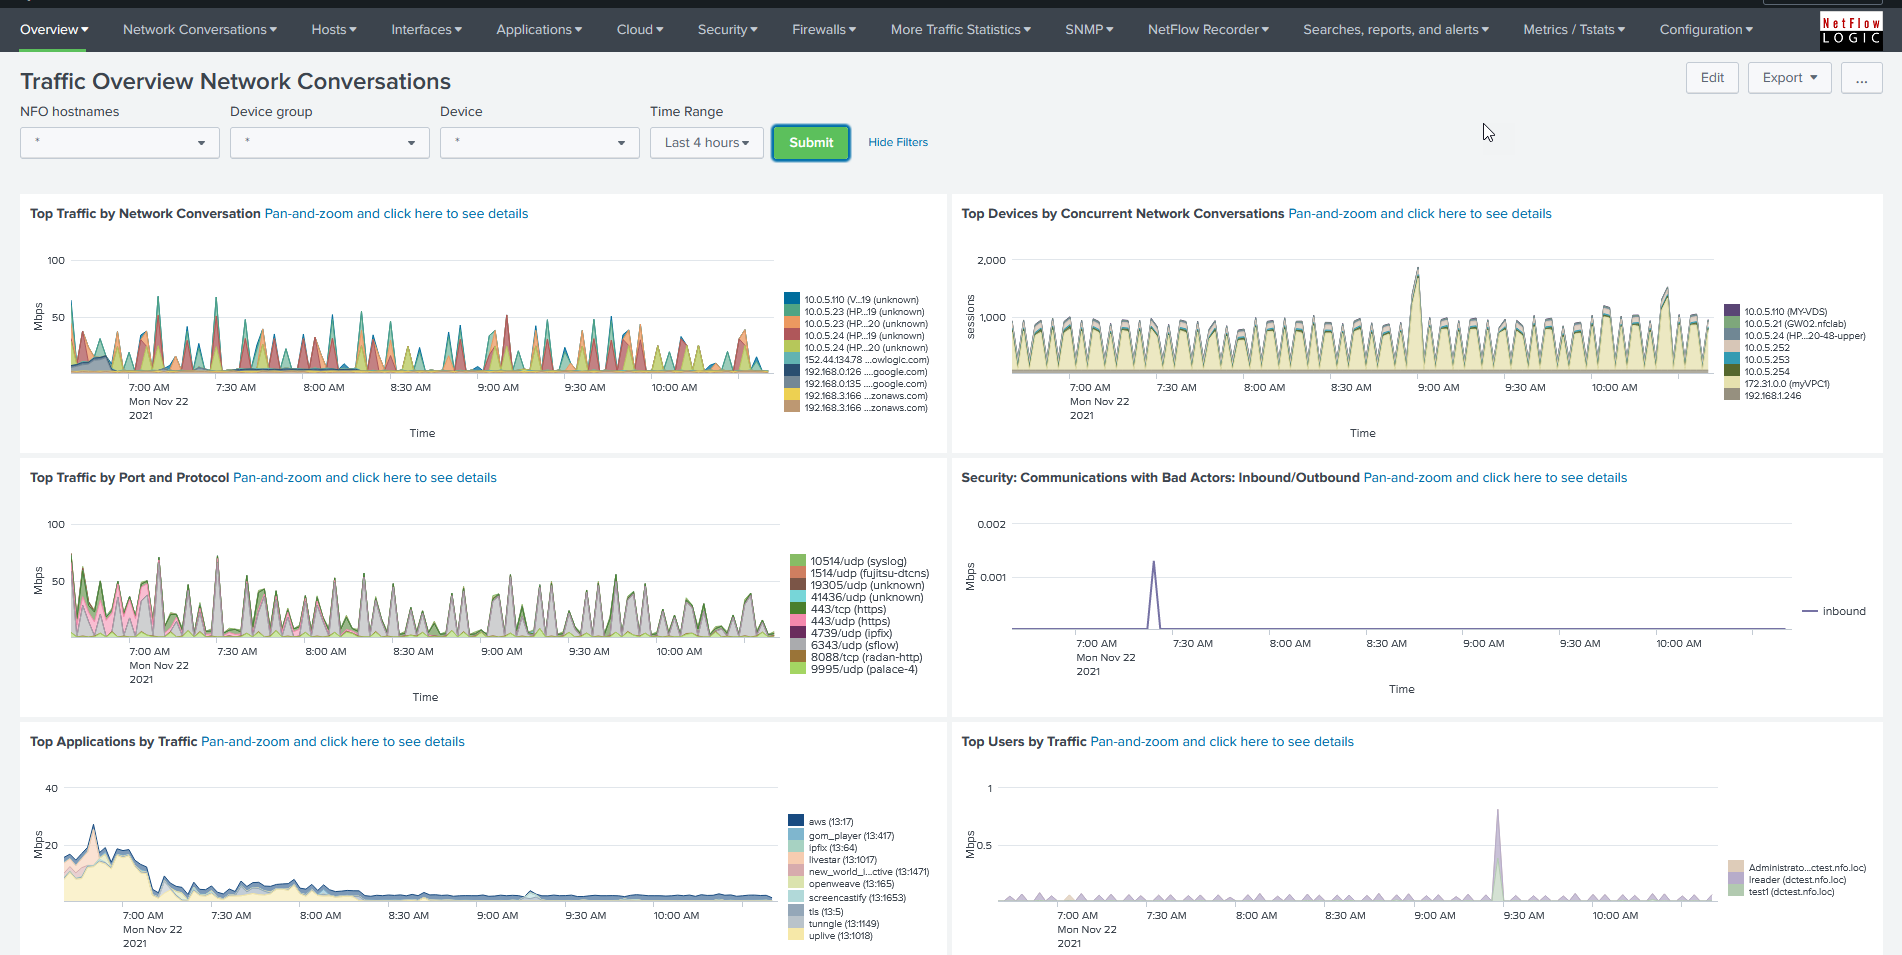 |
| Network Conversations by Traffic: Monitors host pairs generating the most traffic; displays bytes, packets, connections, and average duration. |  |
| Network Conversations by Protocol and Port: Monitors host pairs by service name and transport protocol port number. | 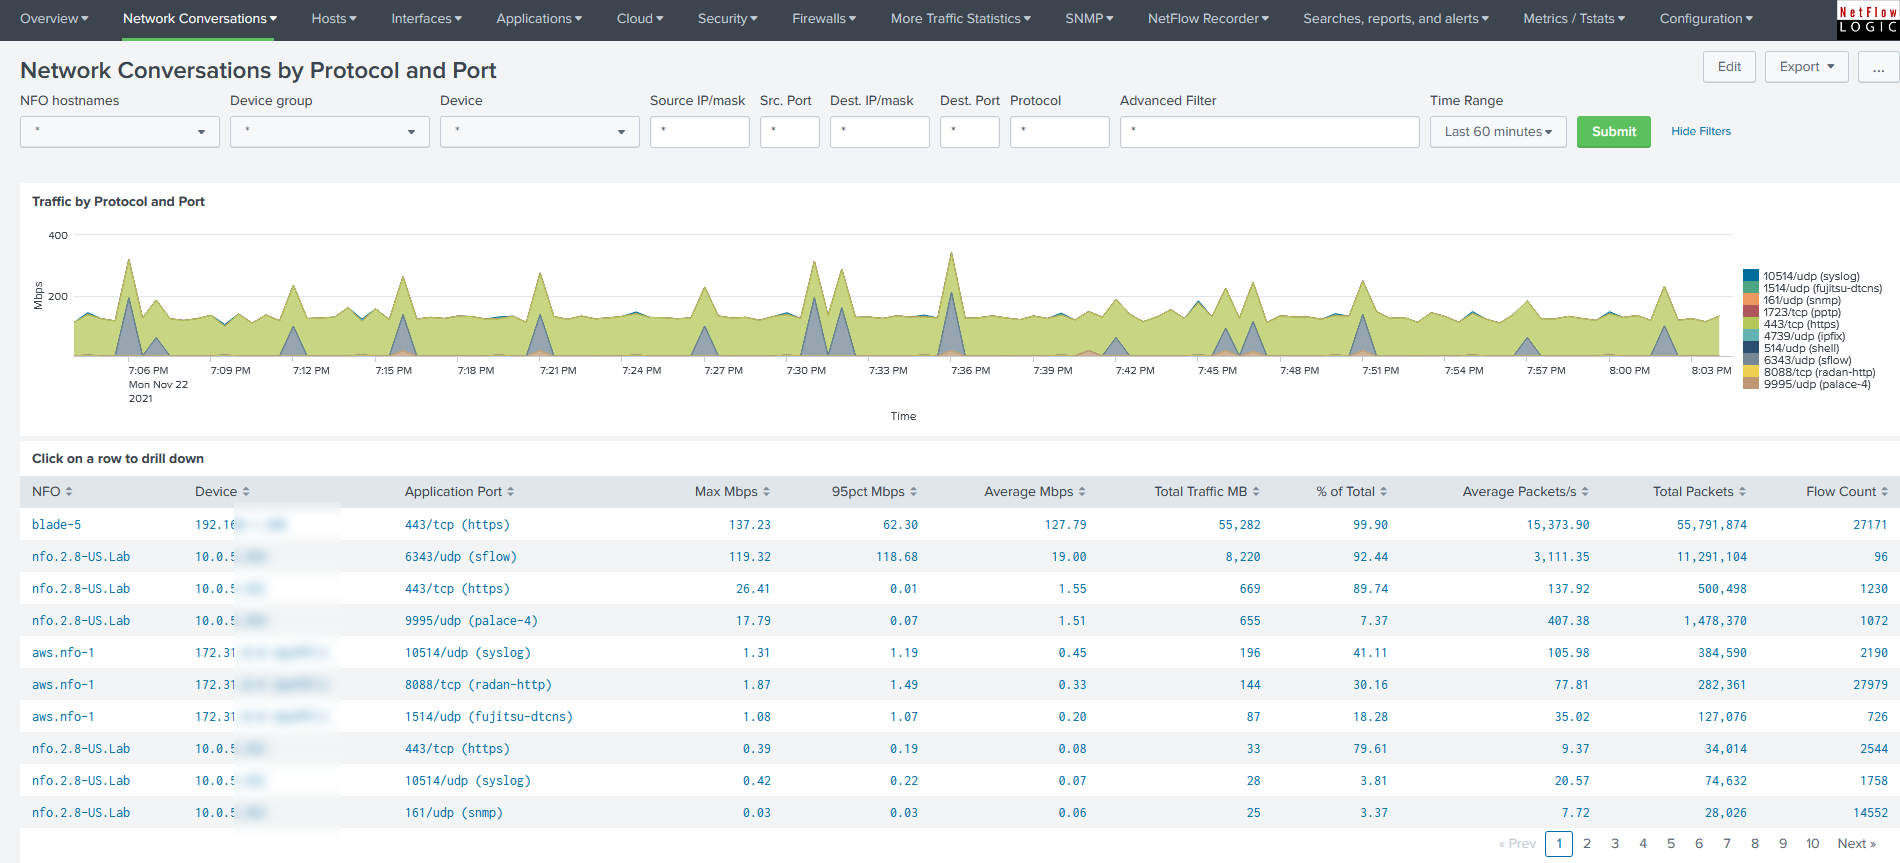 |
| Network Conversations Cyber Threats: Shows conversations with malicious hosts and their geographical locations based on threat lists configured in NFO. | 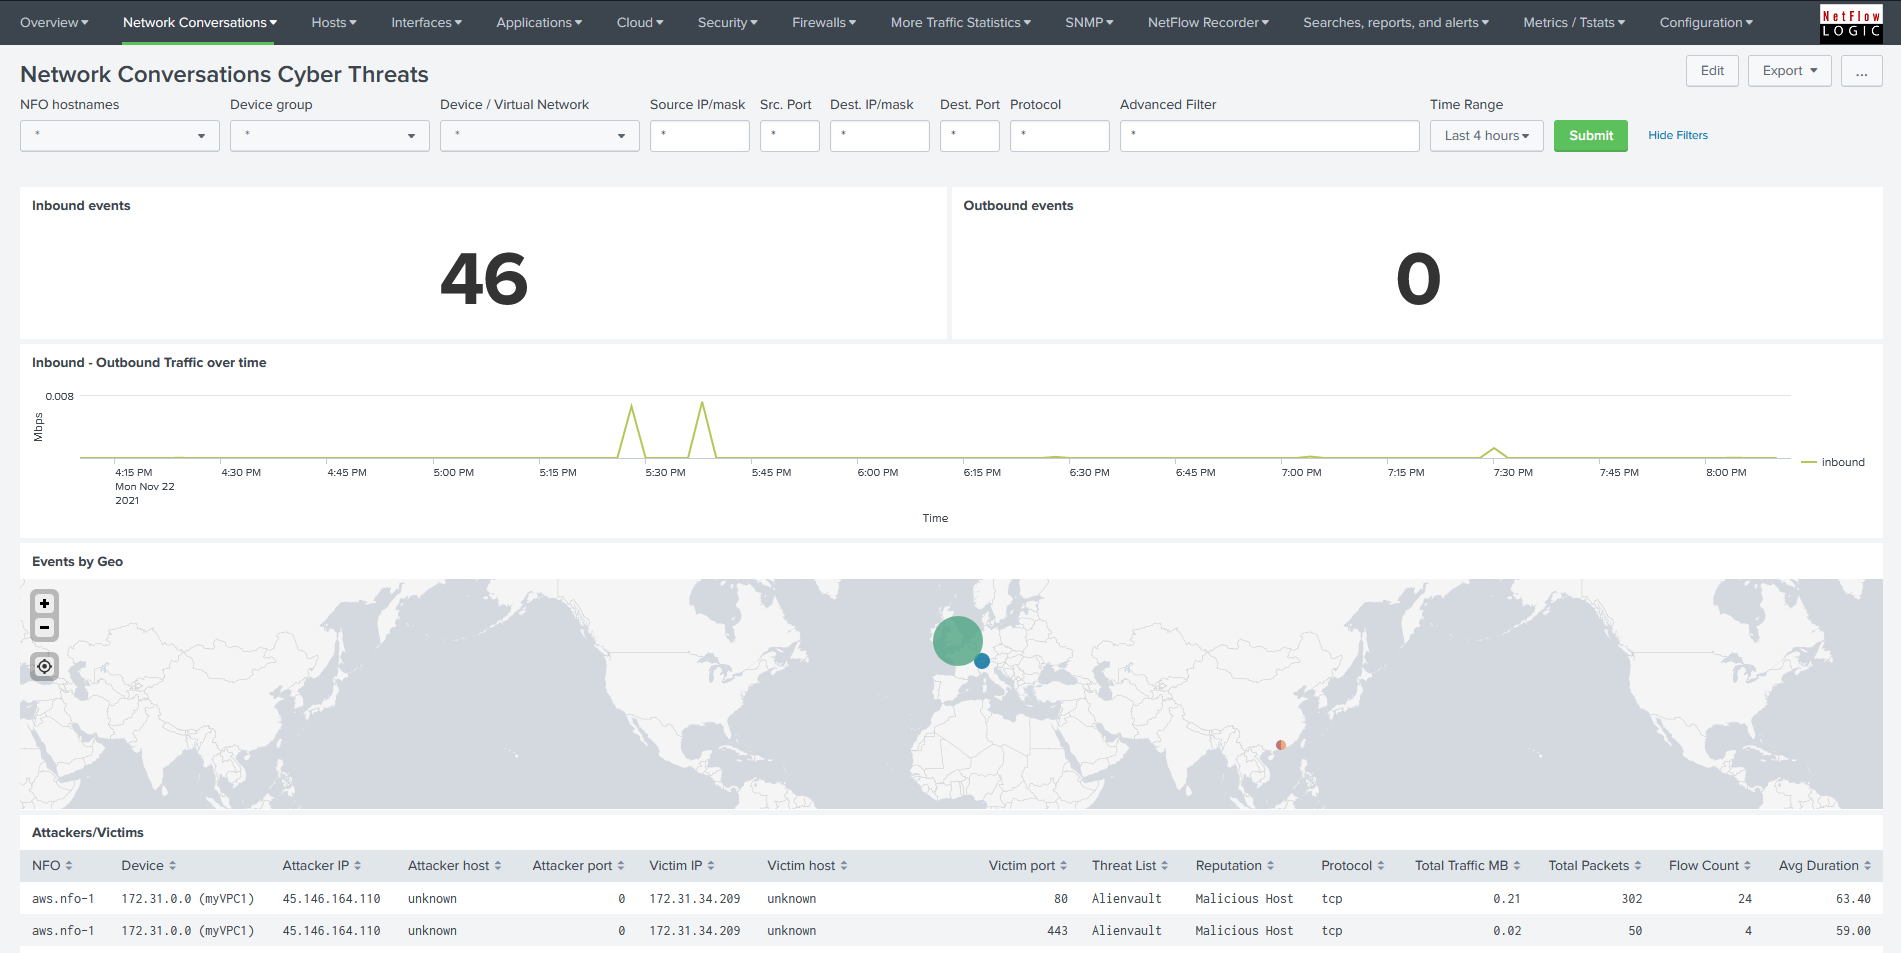 |
| Traffic Using Critical Ports: Shows DNS traffic (top panels), and traffic over critical ports (e.g. 21(ftp), 22(ssh), 23(telnet), 25(smtp), 50(re-mail-ck), 51(la-maint), 67(bootps), 68(bootpc), 115(sftp), 123(ntp), etc.). | WIP |
| Network Conversations Top Applications: Monitors host pair traffic by application name as reported in NetFlow/IPFIX by supported vendors. | 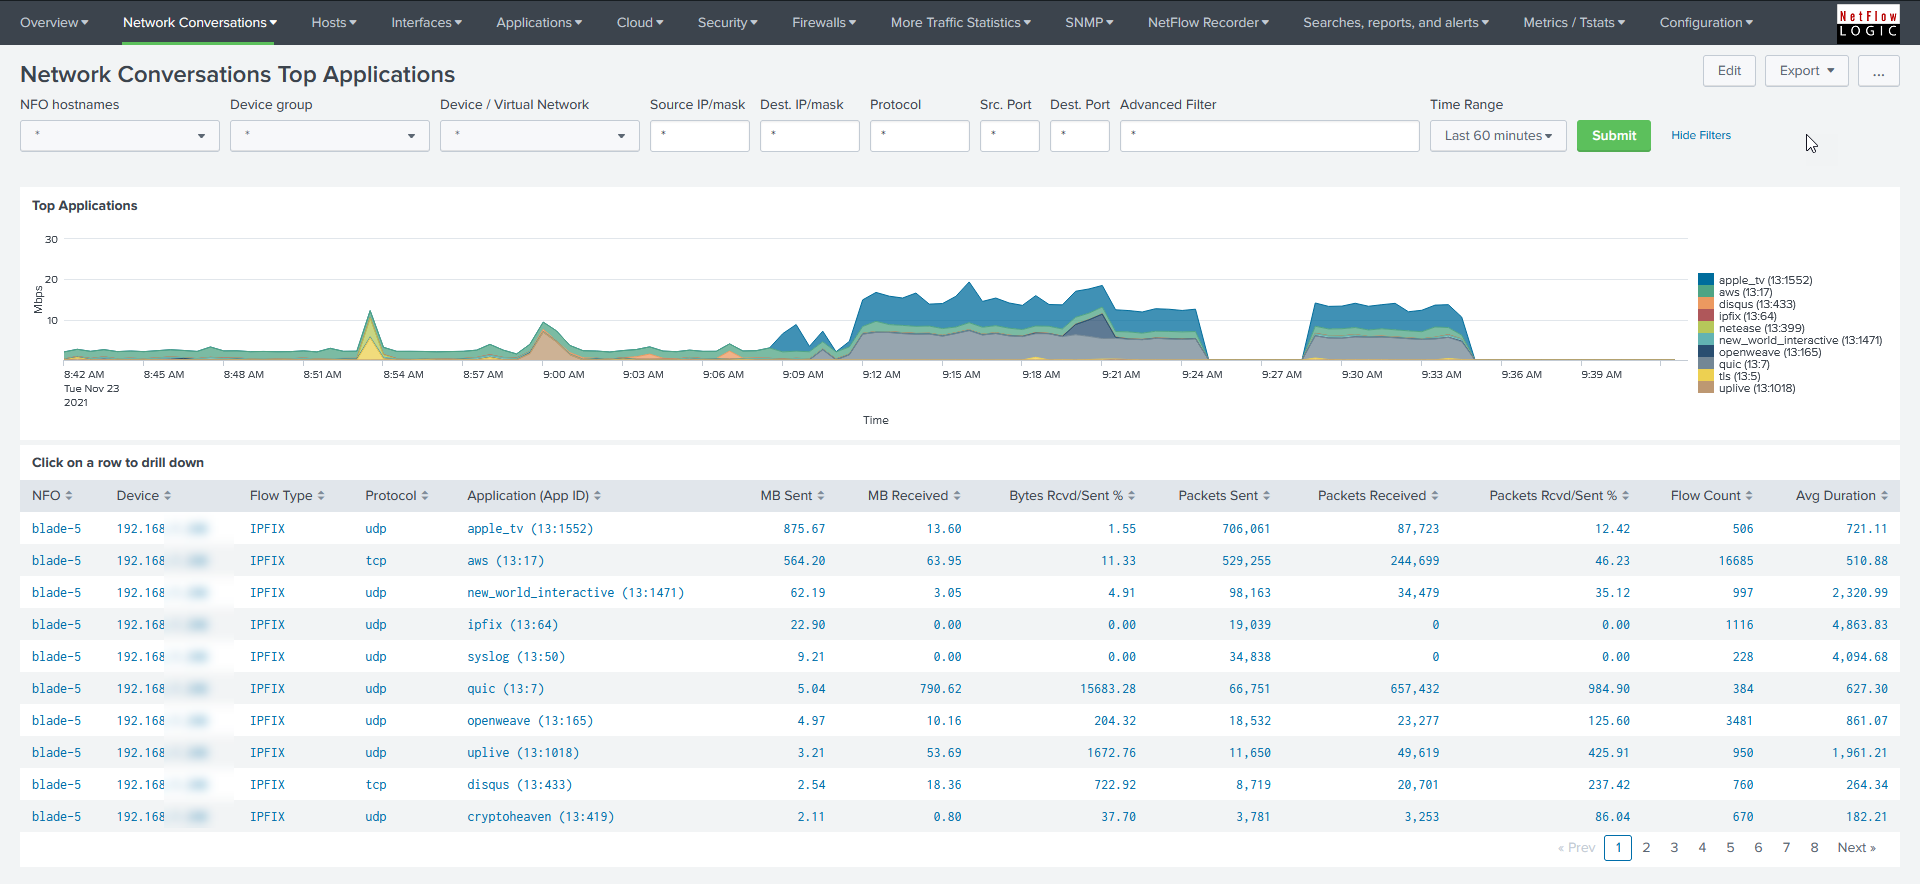 |
| Network Conversations Top Users: Monitors traffic by users; user identity is added to the NFO output during real-time processing. | 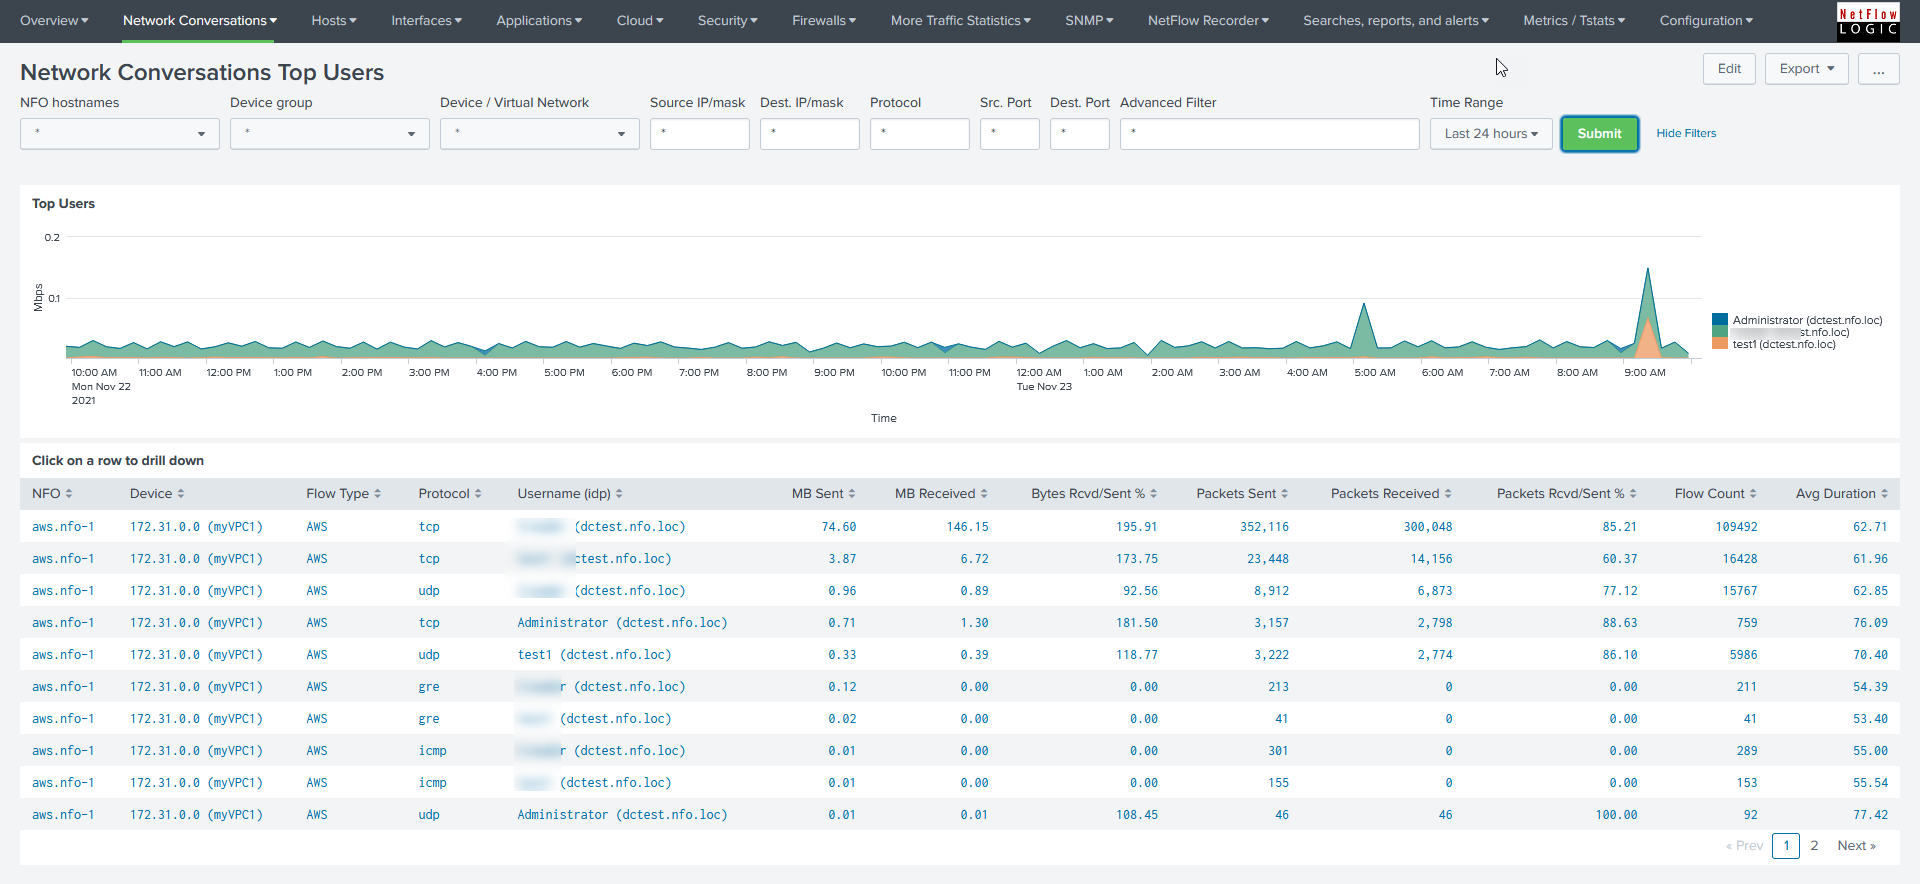 |
| Network Conversations Top Applications and Users: Enables monitoring of host pair traffic by application with drill-down capabilities to the user level. |  |
| Network Conversations Accepts-Rejects: Displays statistics for accepted versus rejected network conversations. | 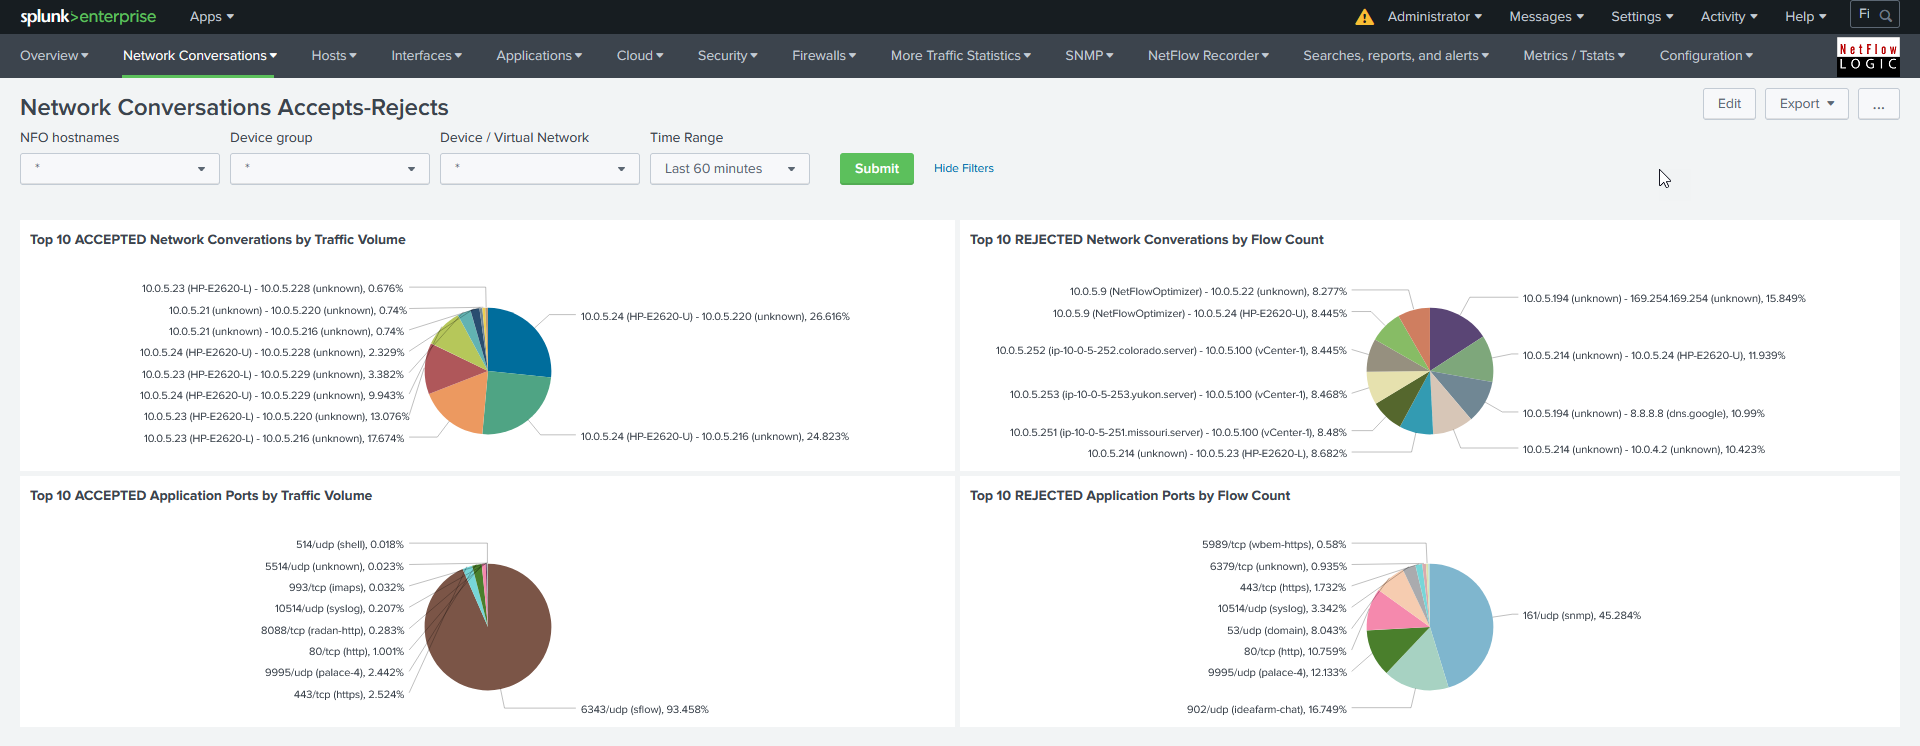 |
| Top Devices by Concurrent connections: Monitors host pairs and reports concurrent connection counts by network device. | 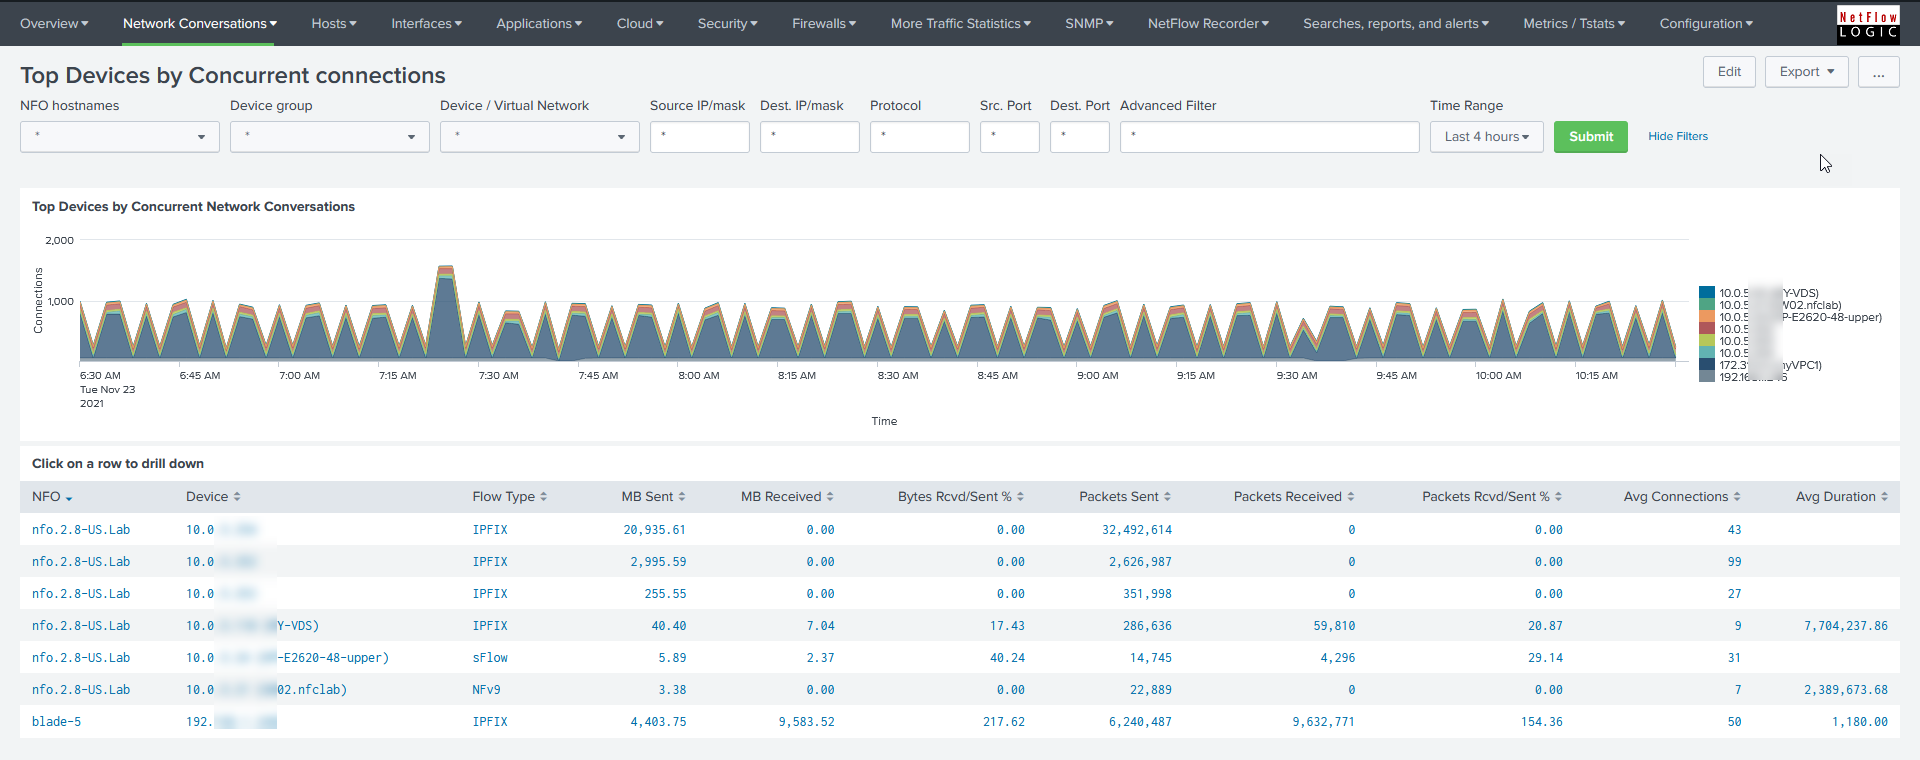 |
| Network Conversations by Duration: Provides monitoring of host pair traffic filtered by session duration. | 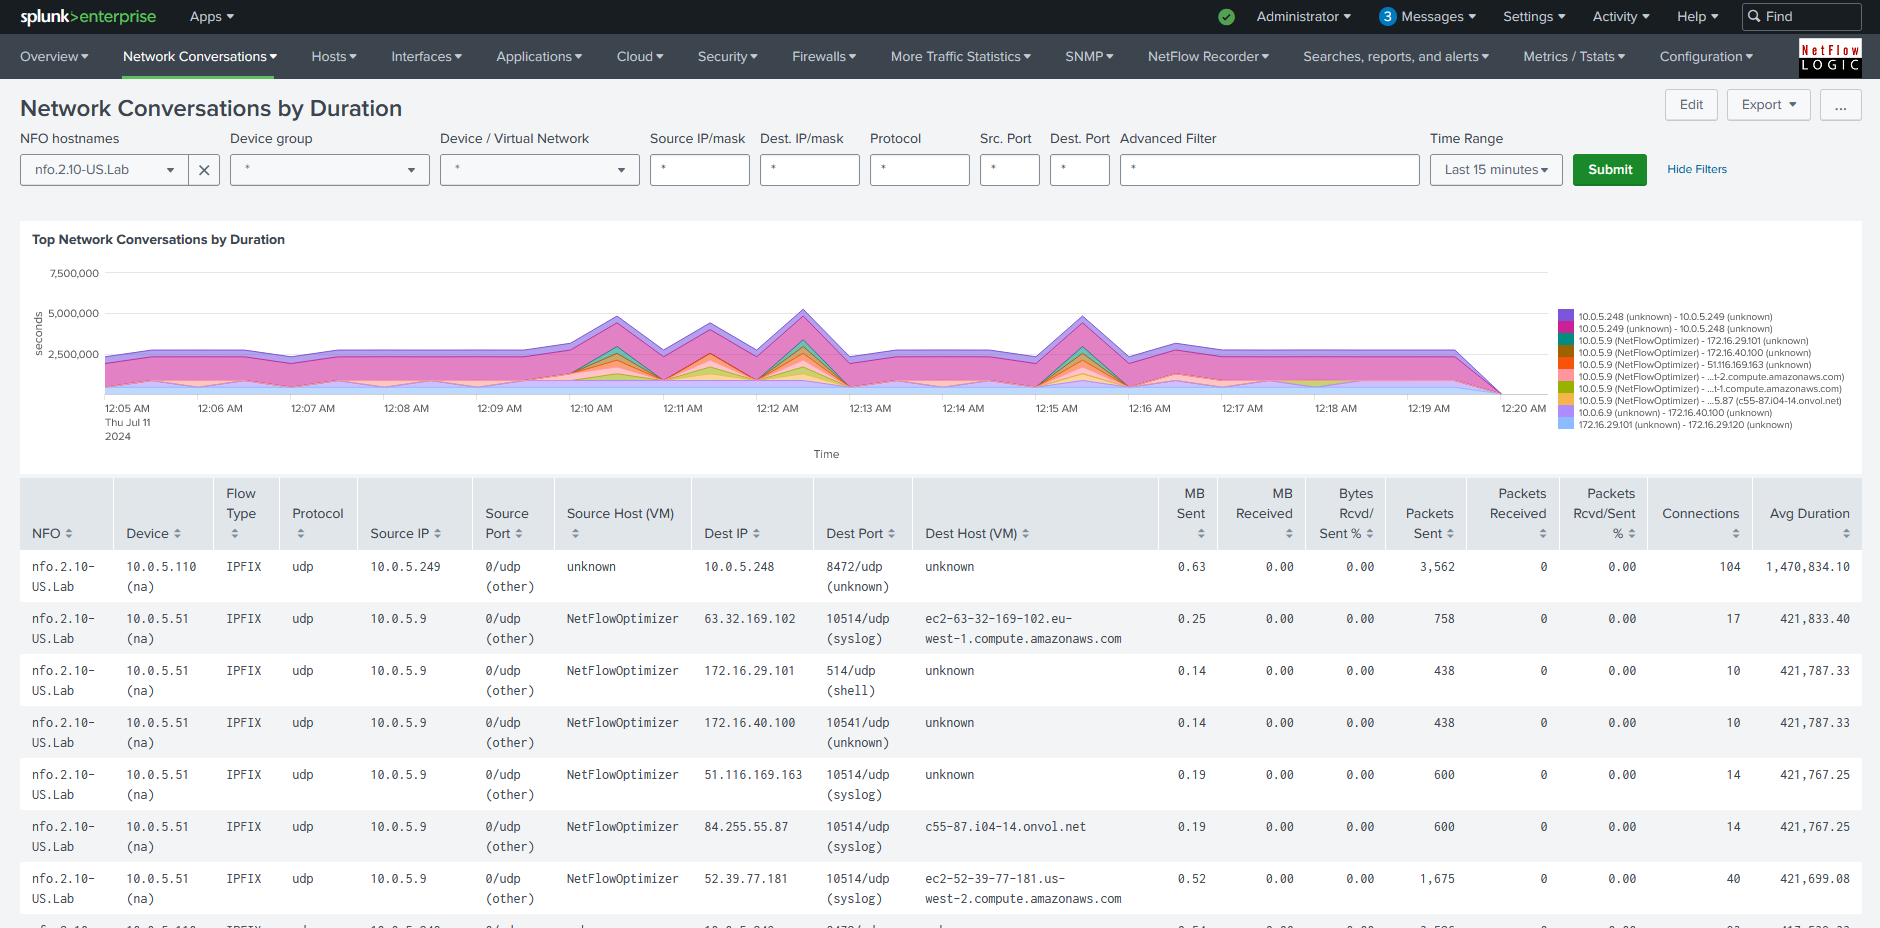 |
| Network Conversations by Country: Enables monitoring of host pair traffic categorized by geographical country. | 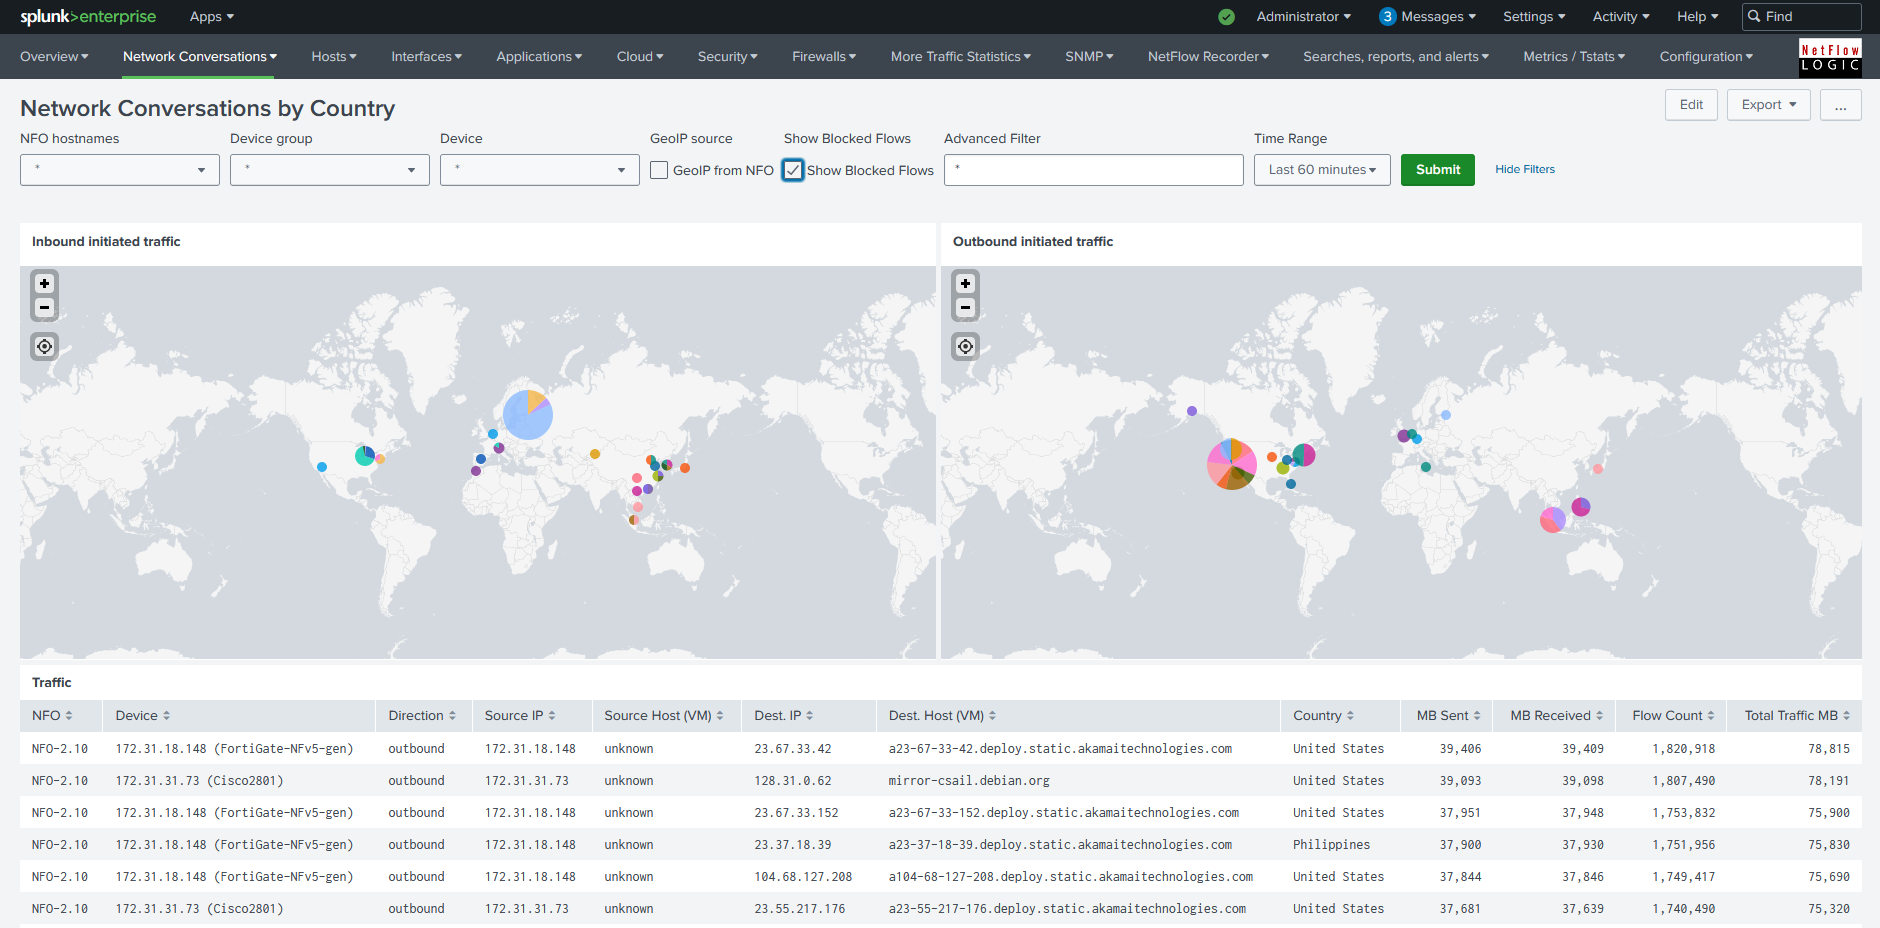 |
| Network Conversations by Autonomous System: Reports network conversations categorized by BGP Autonomous System (AS). | 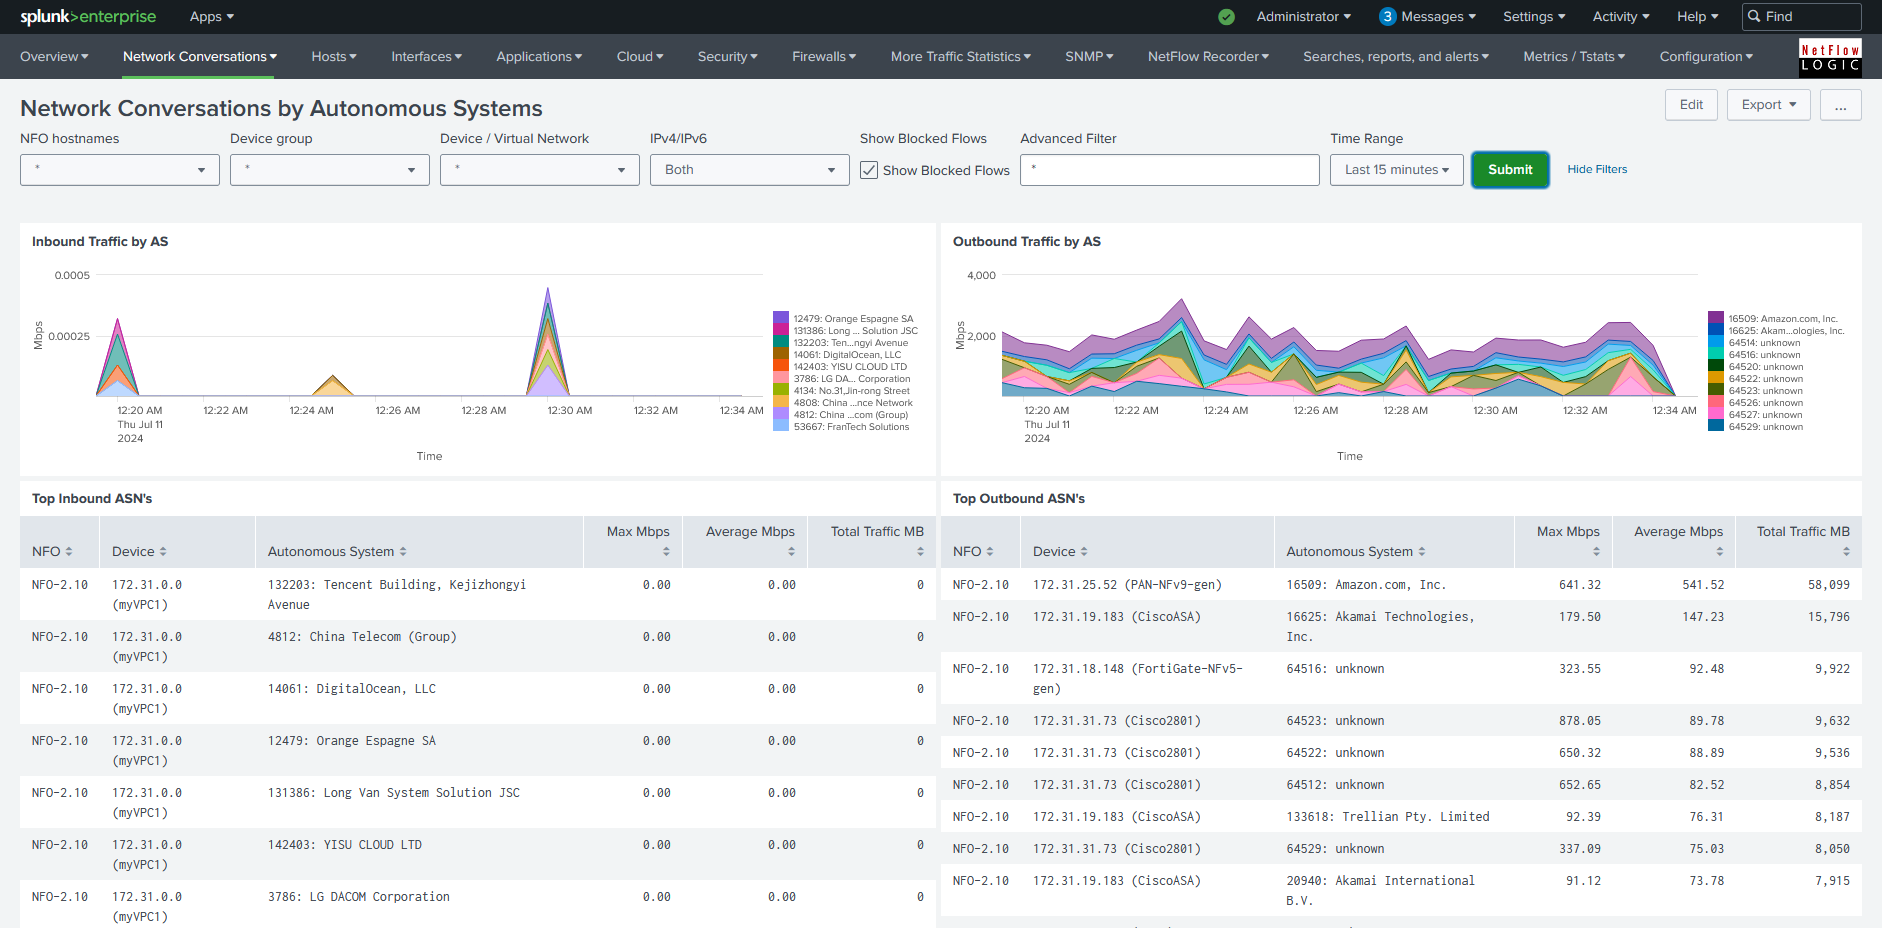 |
| Network Conversations with NetScaler RTT and Retransmissions: Reports Round Trip Time (RTT) and TCP retransmission counts specifically from Citrix NetScaler data. | 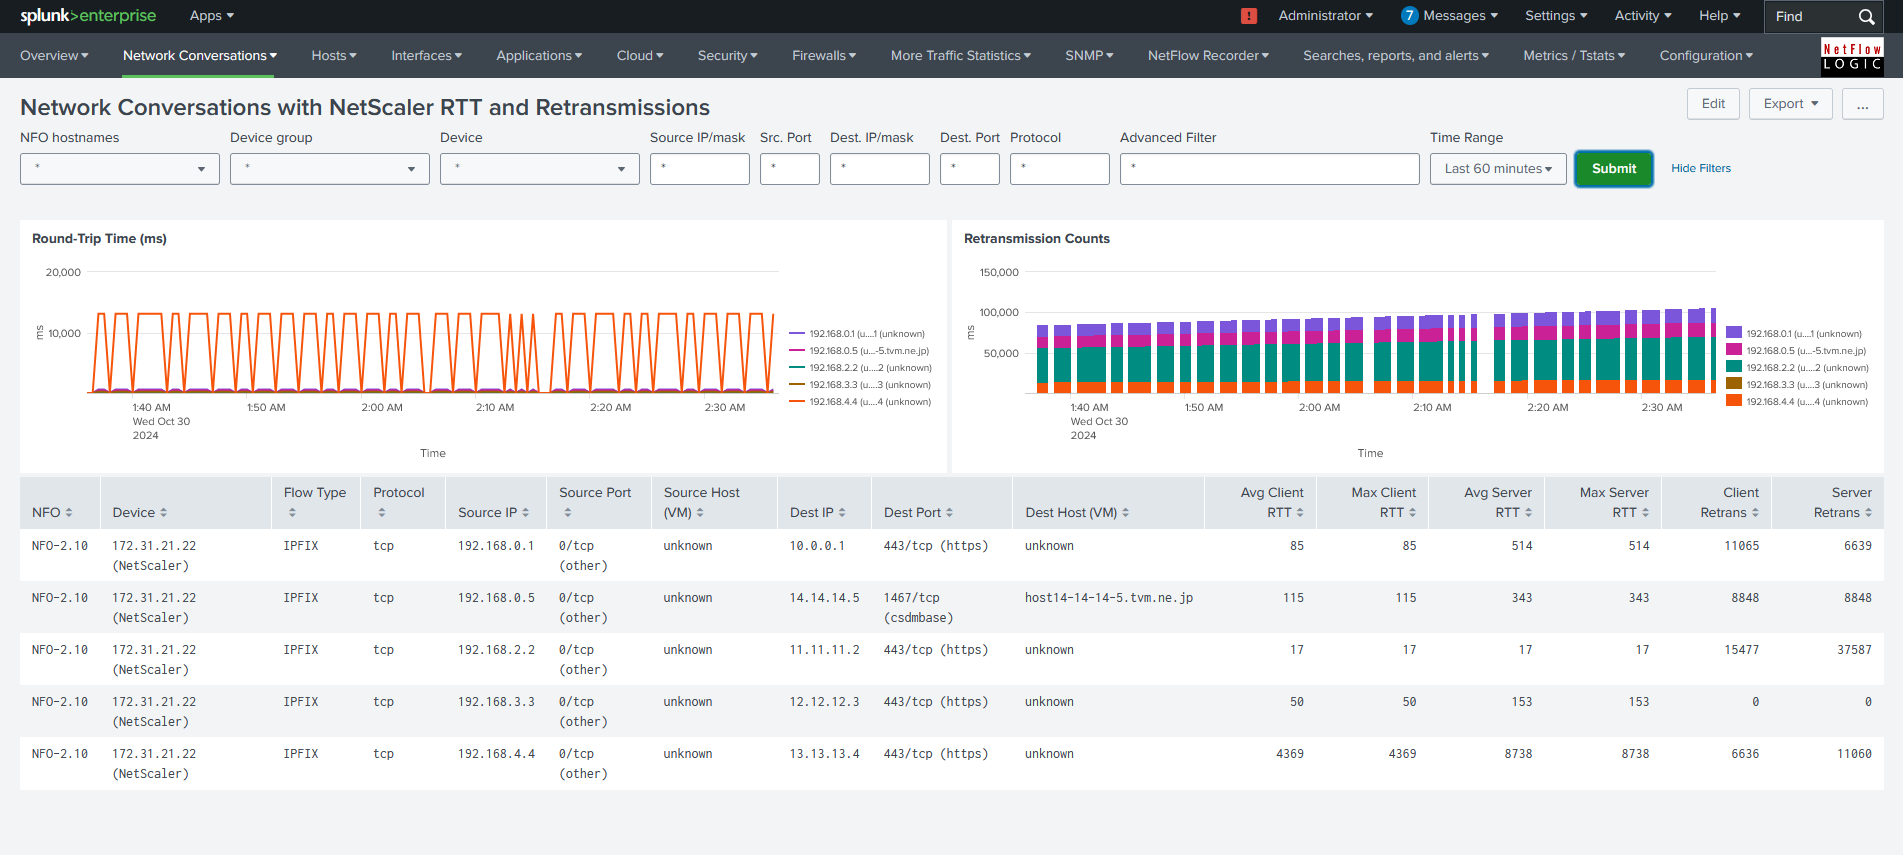 |
| Network Conversations Top Violators: Reports top firewall policy violators from devices like Cisco ASA, Palo Alto Networks, and Fortinet. | 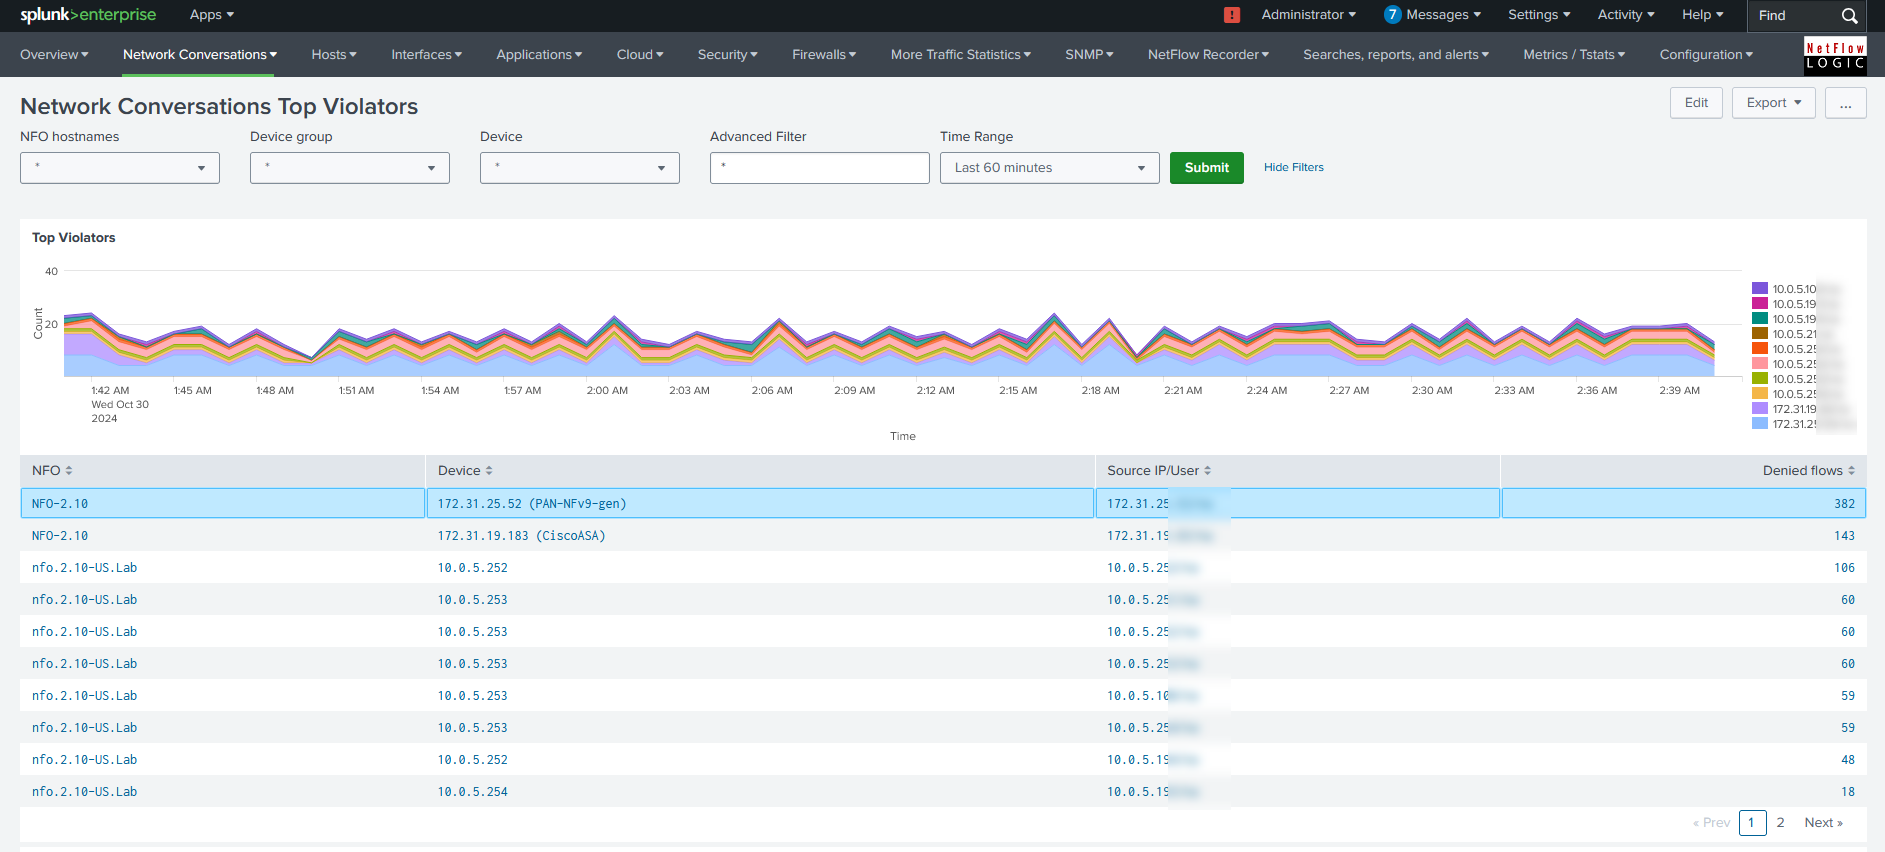 |
| Network Conversations by VLAN: Reports VLAN-to-VLAN traffic with drill-down to communicating peer details. | 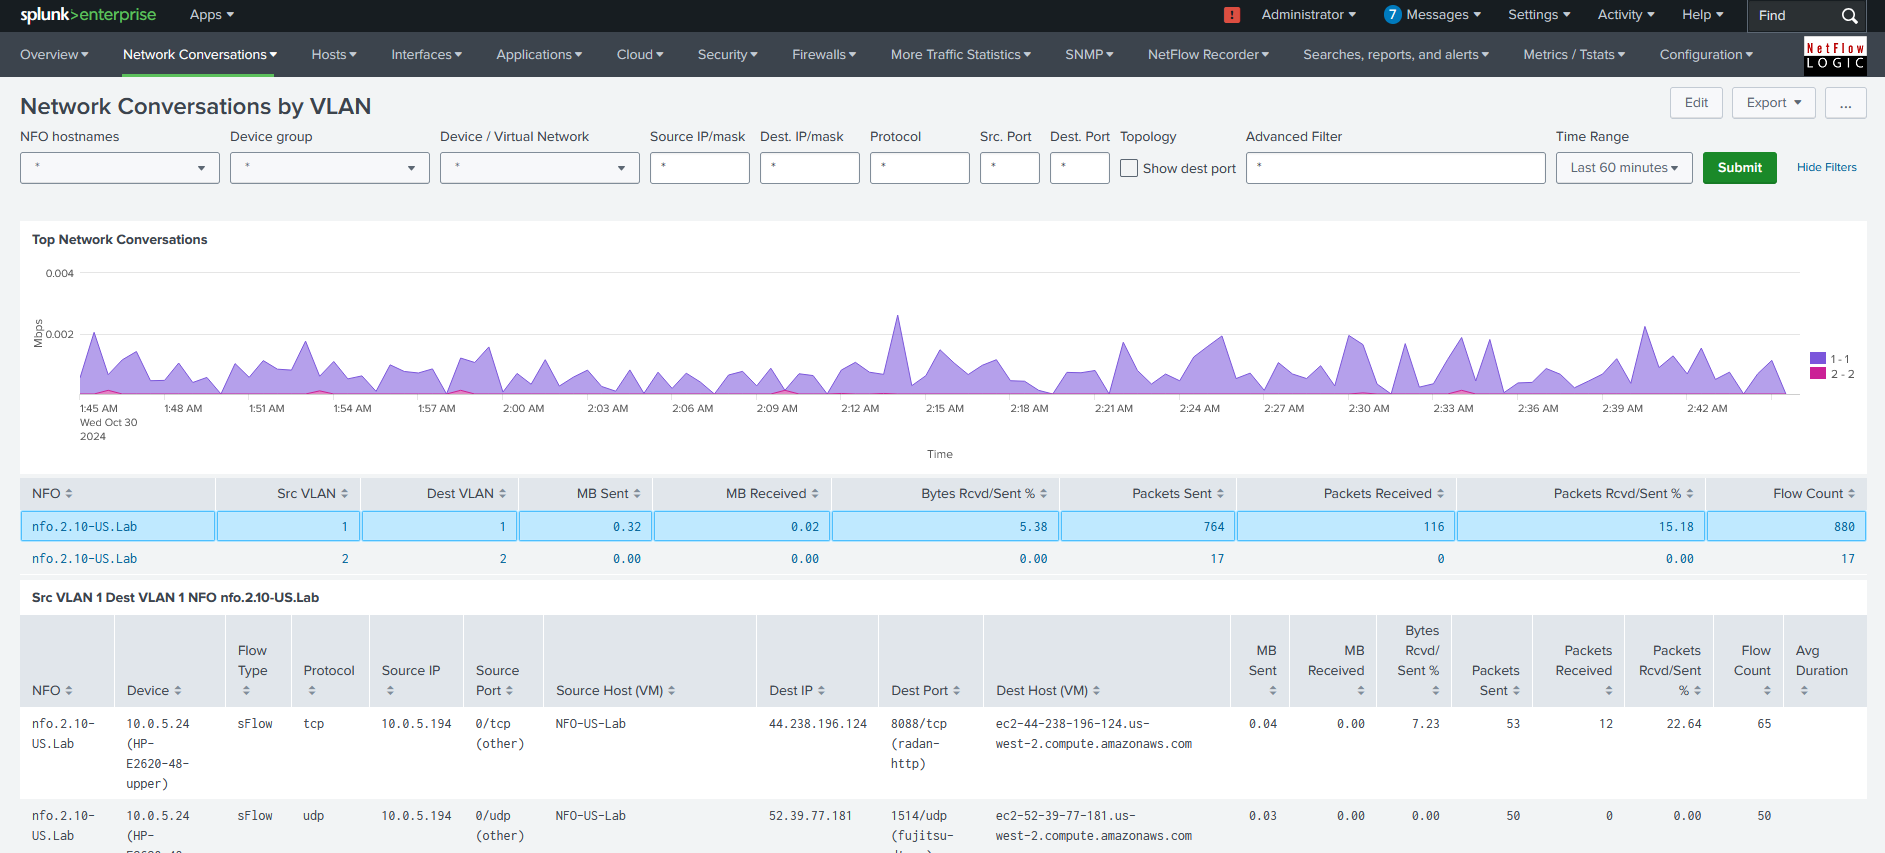 |
| Network Conversations with Cisco ACI BD/Tenant Mapping: Visualizes traffic volume across Cisco ACI environments, highlighting bandwidth for source/destination tenants and cross-tenant patterns. | 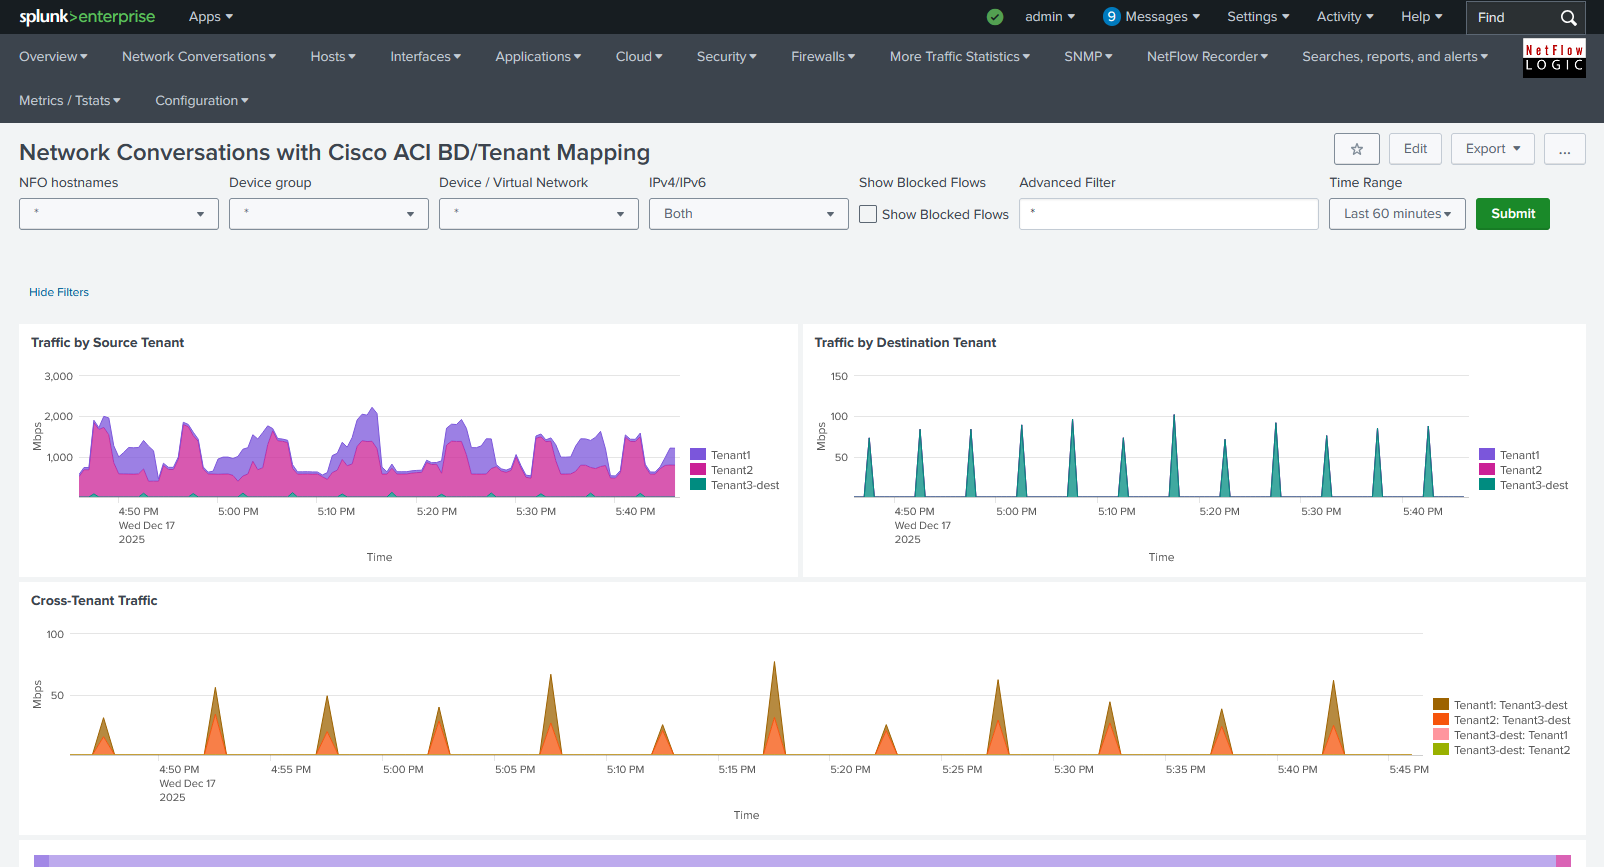 |
2. Bandwidth & Top Traffic (Module 10067)
These dashboards focus on unidirectional volume and "Top N" reporting. They are organized into two primary groups: Hosts (peer-to-peer visibility) and Interfaces (device-level visibility).
Hosts
These dashboards view traffic statistics from the communicating peers' point of view.
| Dashboard Description | Click to Zoom |
|---|---|
| Traffic by Source IP: Shows top talkers with the ability to drill down to communicating peers and reporting network devices. |  |
| Traffic by Destination IP: Shows top listeners. | 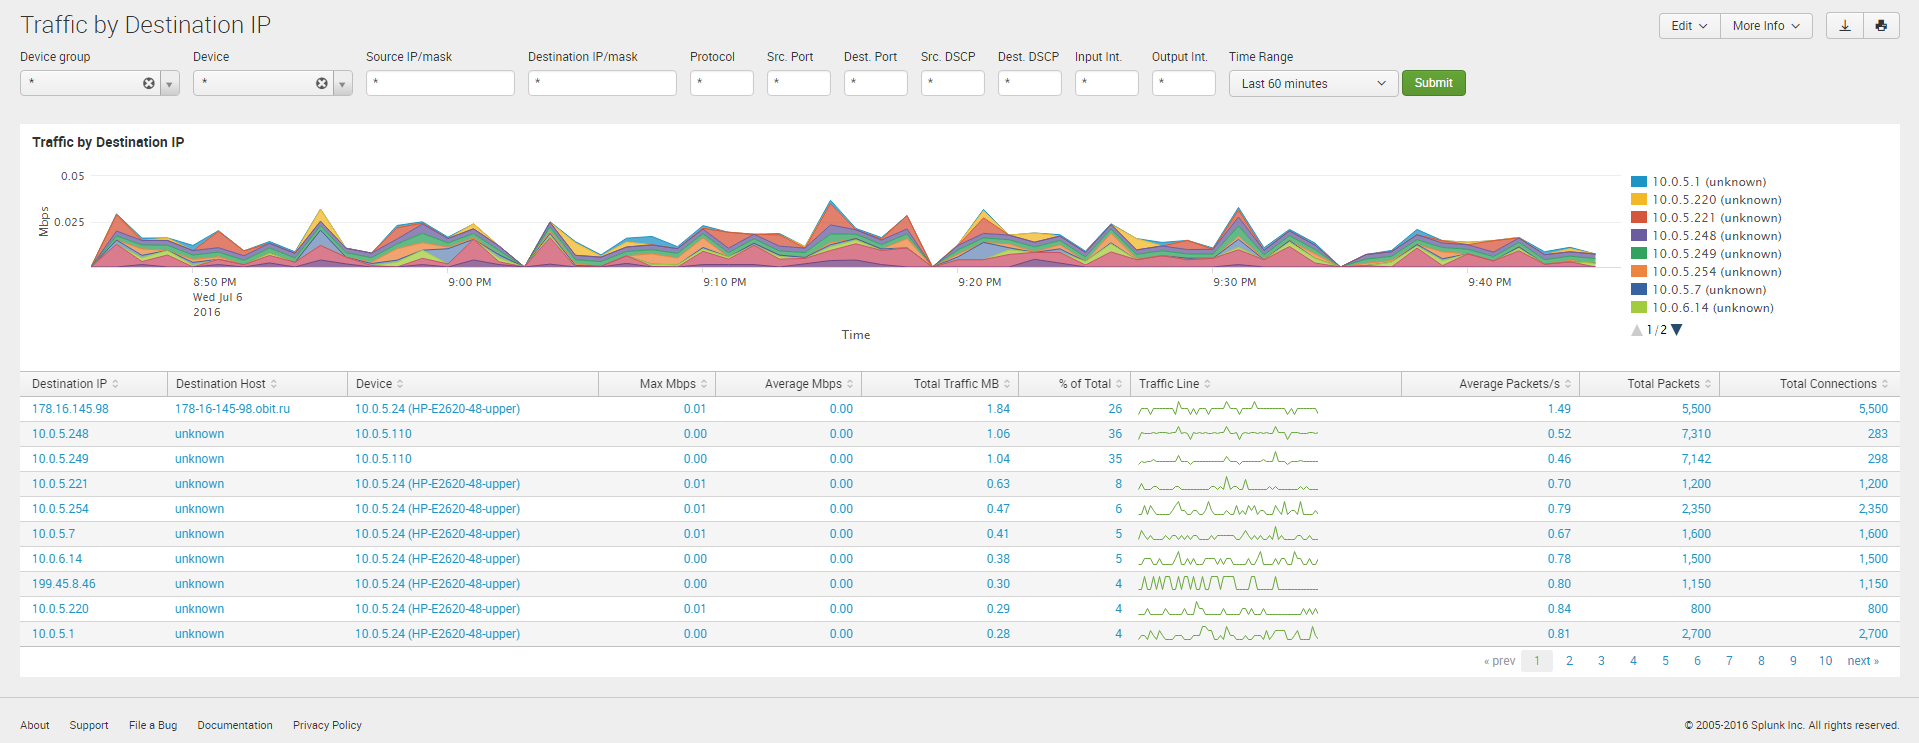 |
| Traffic by Protocol and Port: Monitors traffic by Service Name and Port Number (IANA). | 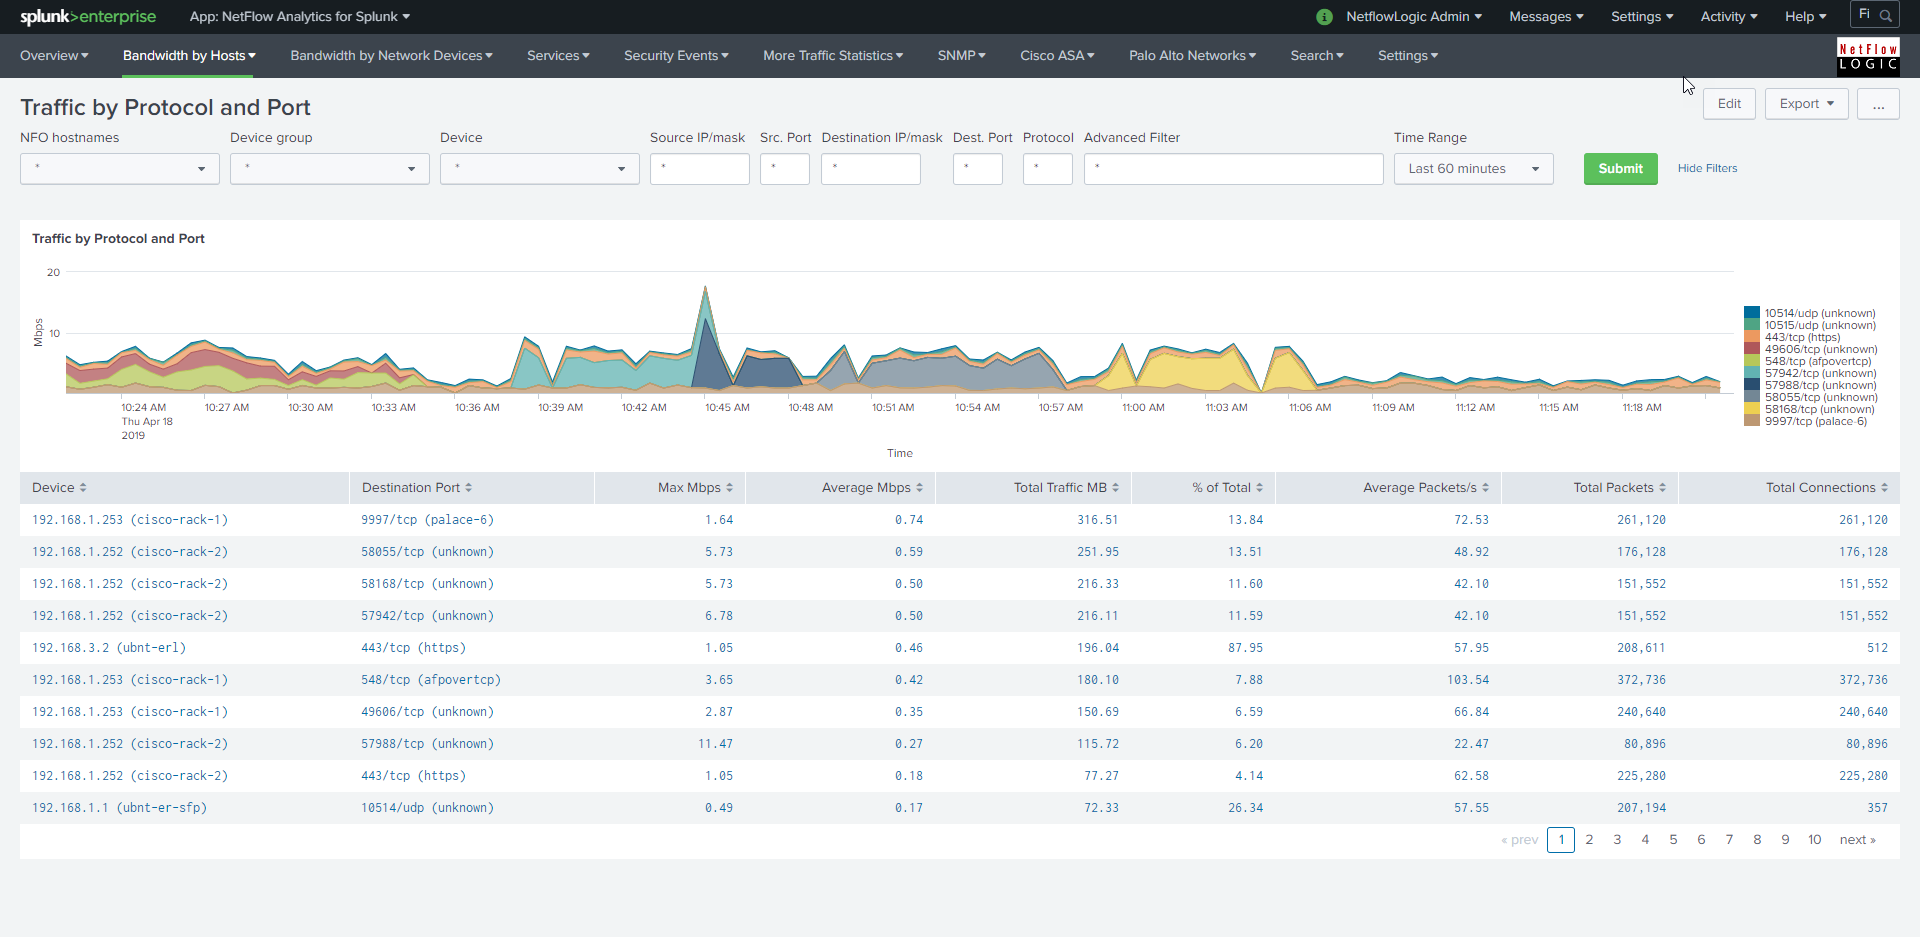 |
| Traffic by Host Pairs: Analyzes specific communication volume between two endpoints (Deprecated Module 10064). (Deprecated) |  |
| Traffic by Protocol: High-level distribution of traffic by protocol type. | 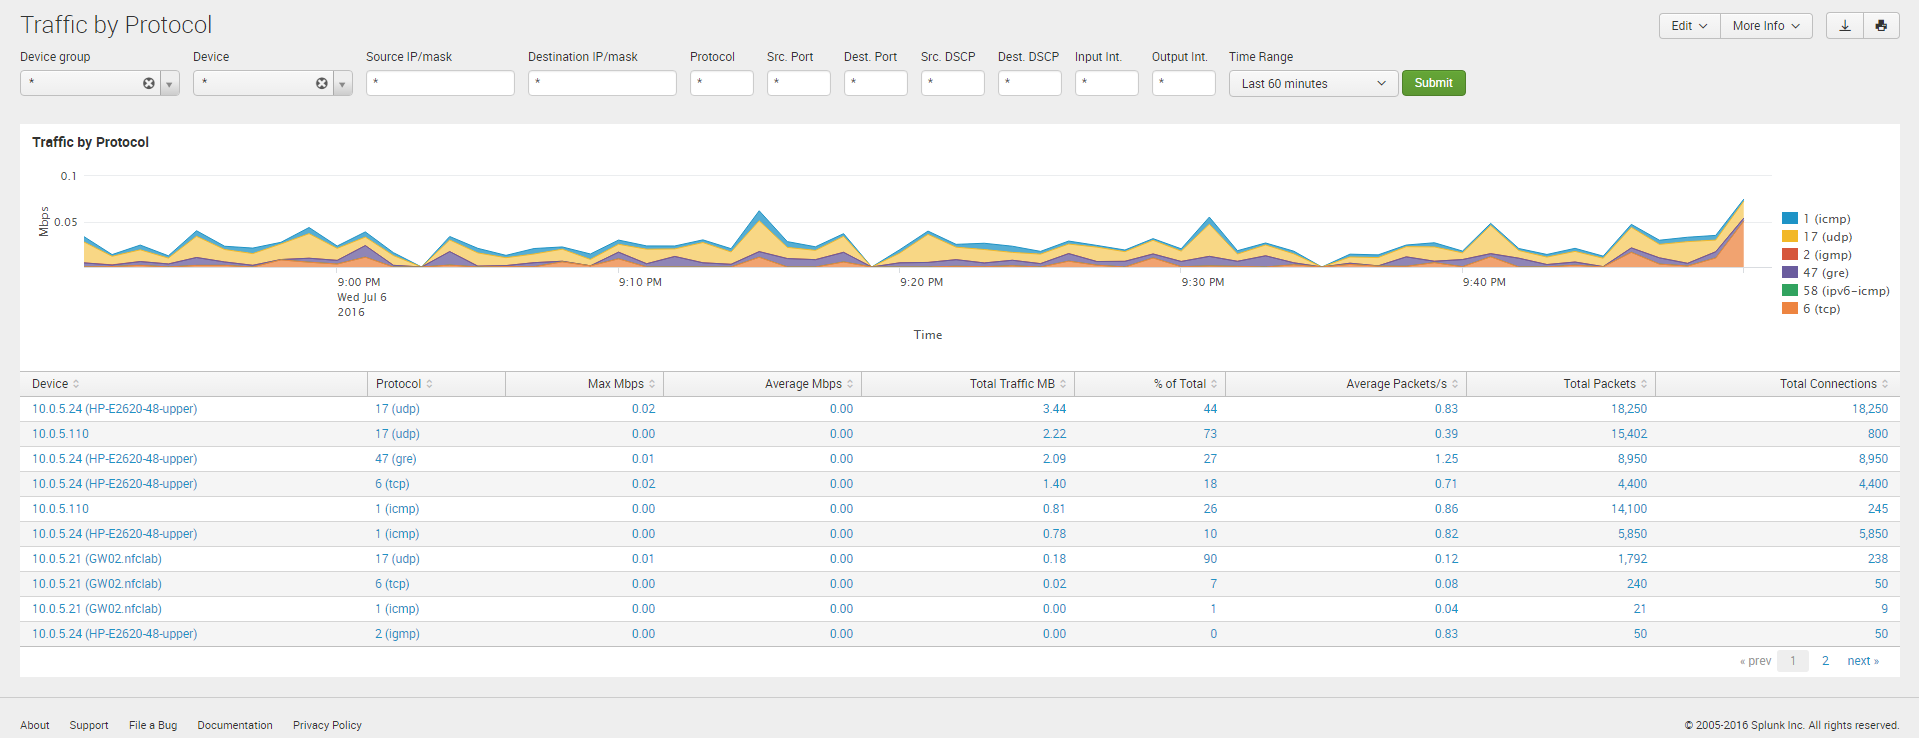 |
| Traffic by Subnets: Aggregates usage by user-defined network boundaries (Deprecated Module 10011). (Deprecated) |  |
Interfaces
These dashboards monitor traffic statistics from the perspective of network devices and their physical/logical ports.
| Dashboard Description | Click to Zoom |
|---|---|
| Top Devices by Traffic: Identifies network devices (exporters) generating the most traffic. | 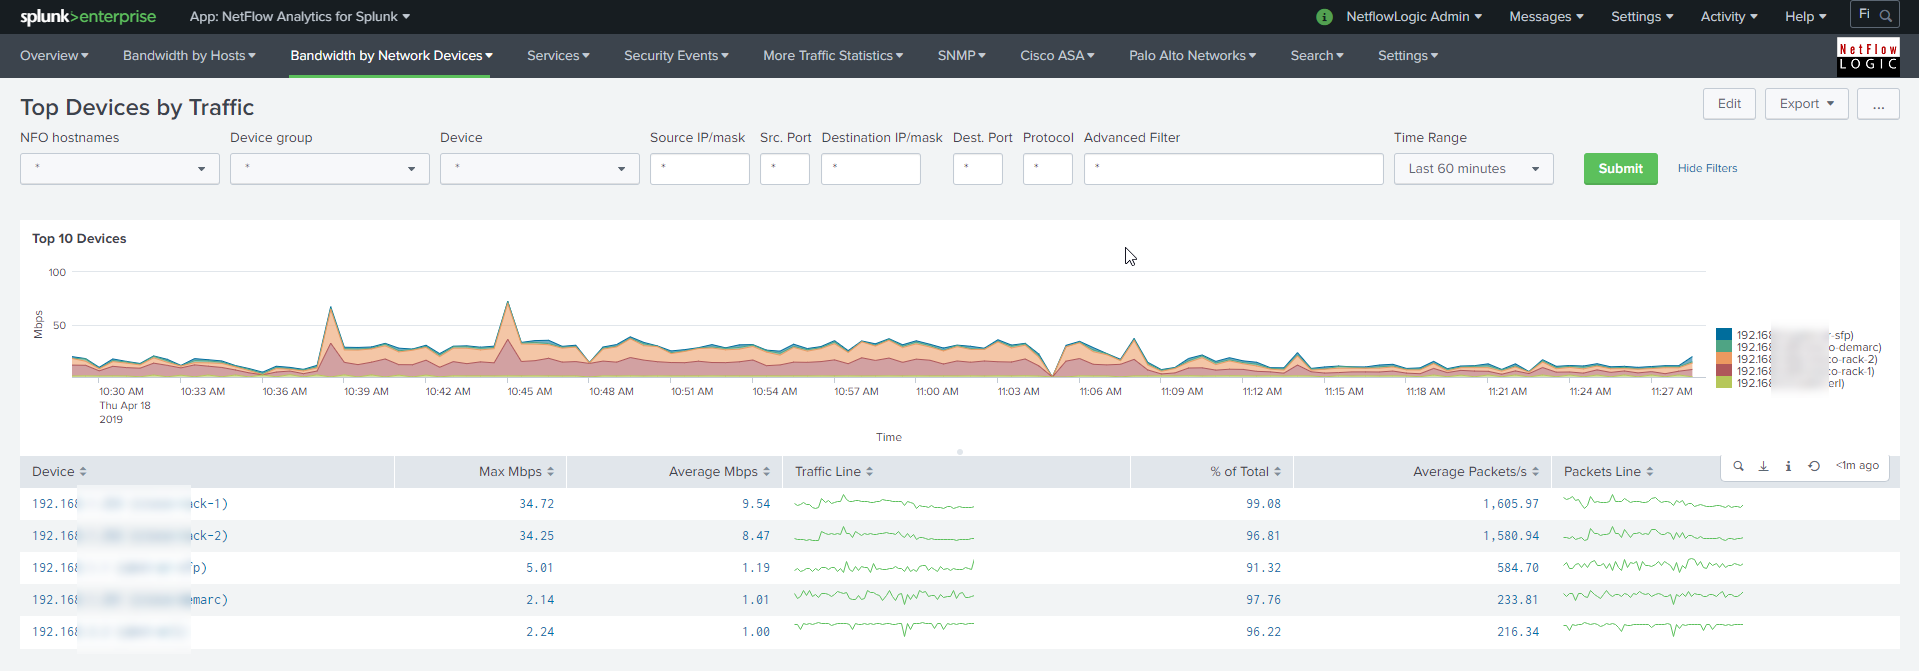 |
| Interfaces Utilization: Displays bandwidth as a percentage of total interface capacity (requires SNMP polling). | 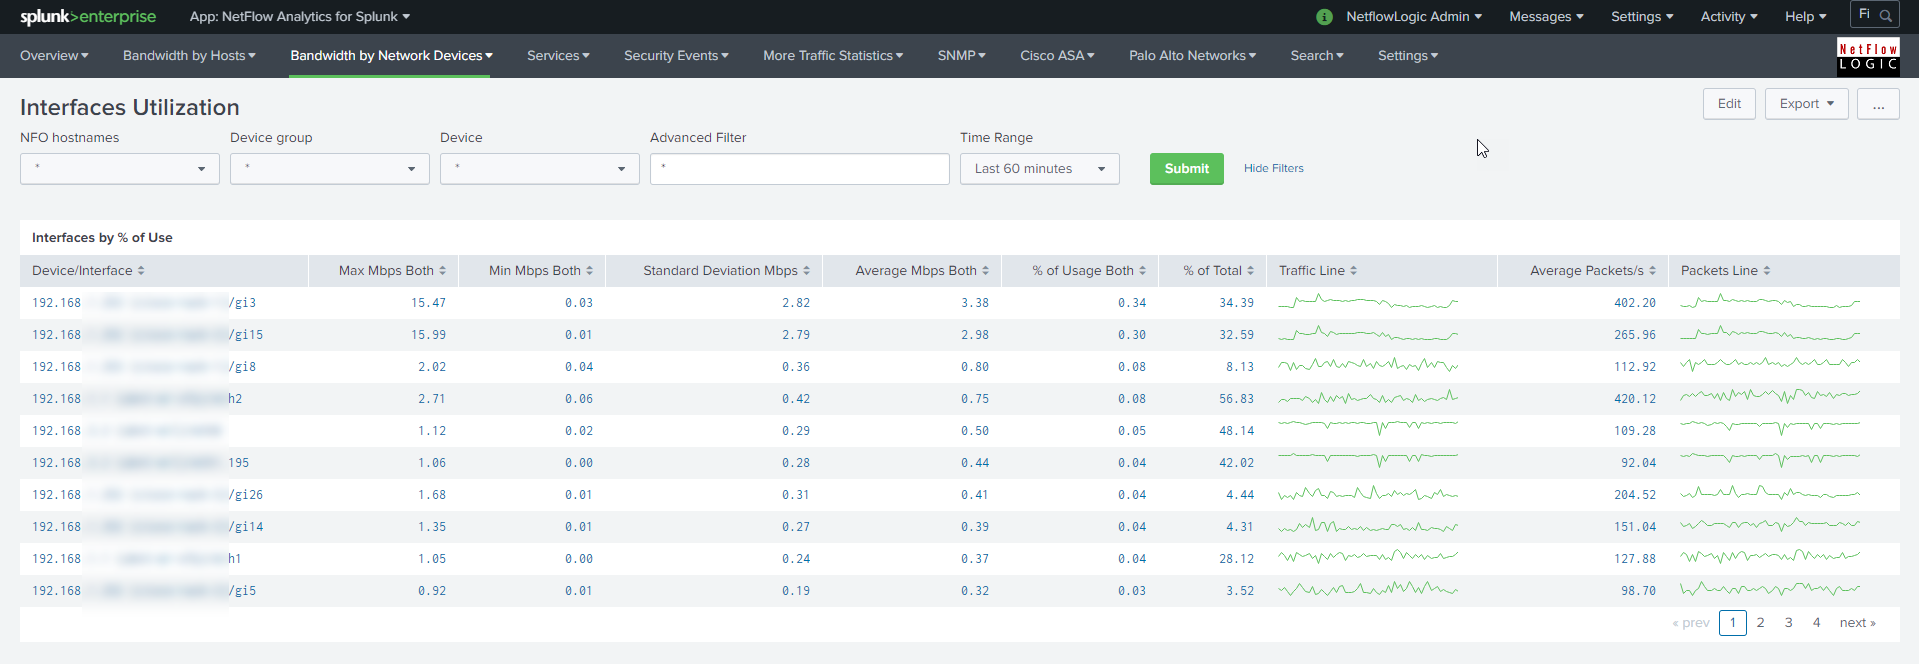 |
| Watched Interfaces Utilization: A focused view for specific "critical" interfaces defined in a lookup file. (Deprecated) |  |
| Interface Groups: Aggregates utilization based on logical interface groupings, interface groups defined in a lookup file. (Deprecated) |  |
3. Services & Protocol Analysis
Specialized monitoring for common infrastructure services and application protocols.
| Dashboard Description | Click to Zoom |
|---|---|
| DNS Security: Monitoring latency time of all DNS servers used in your network. Also reports top DNS users. | 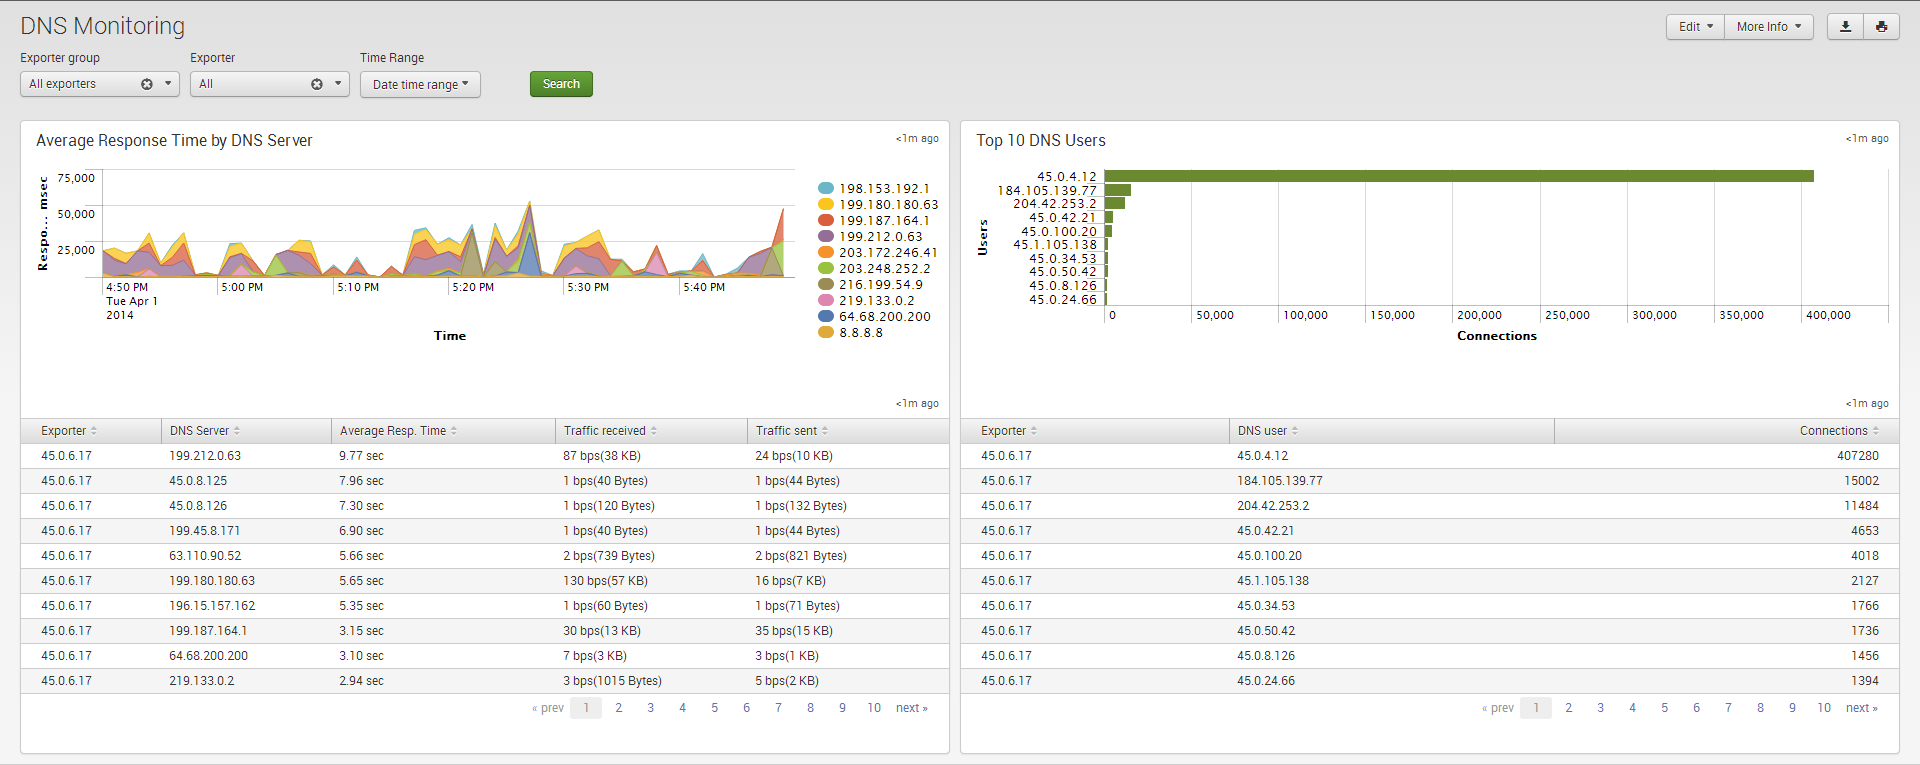 |
| Network Traffic by CBQoS: Analysis of traffic by Quality of Service (QoS). | 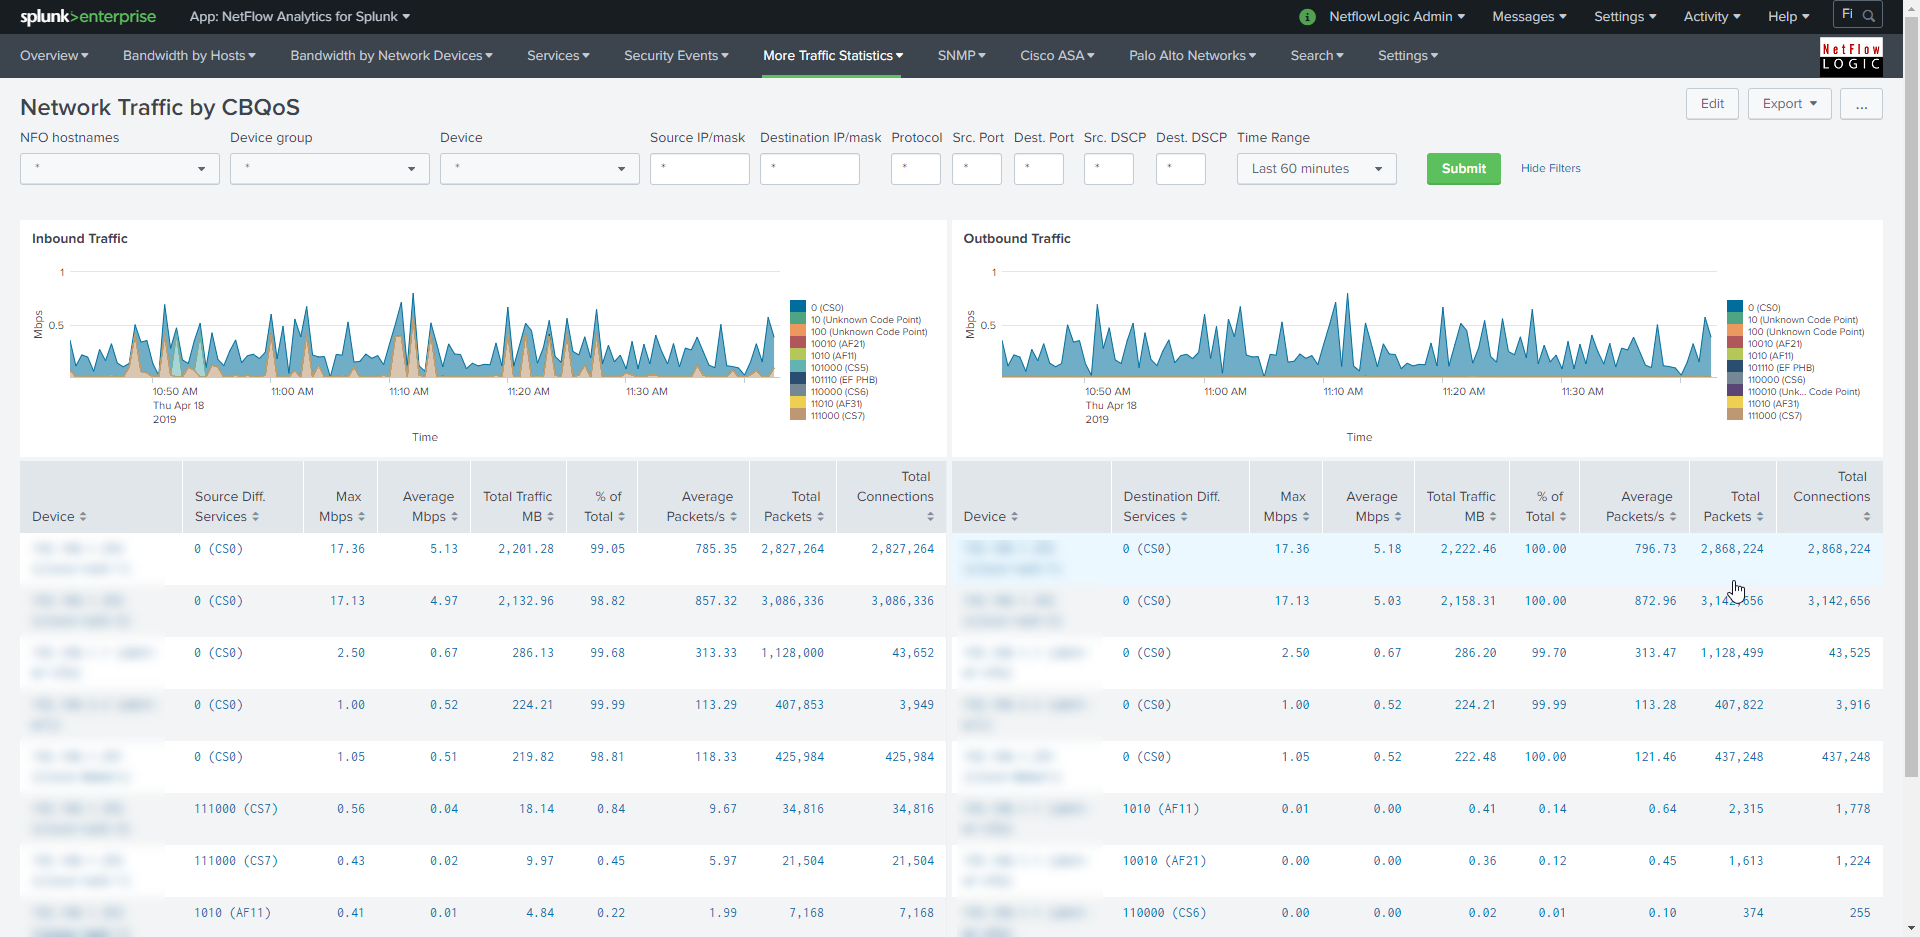 |
| Microsegmentation Analyzer and Planning: Shows traffic in and out of your datacenter (East-West, South-North) as well as other subnet based statistics. |  |
| Traffic Analyzer and Planning: Shows traffic in and out of your datacenter (East-West, South-North). It supports up to four-level subnets hierarchy. | 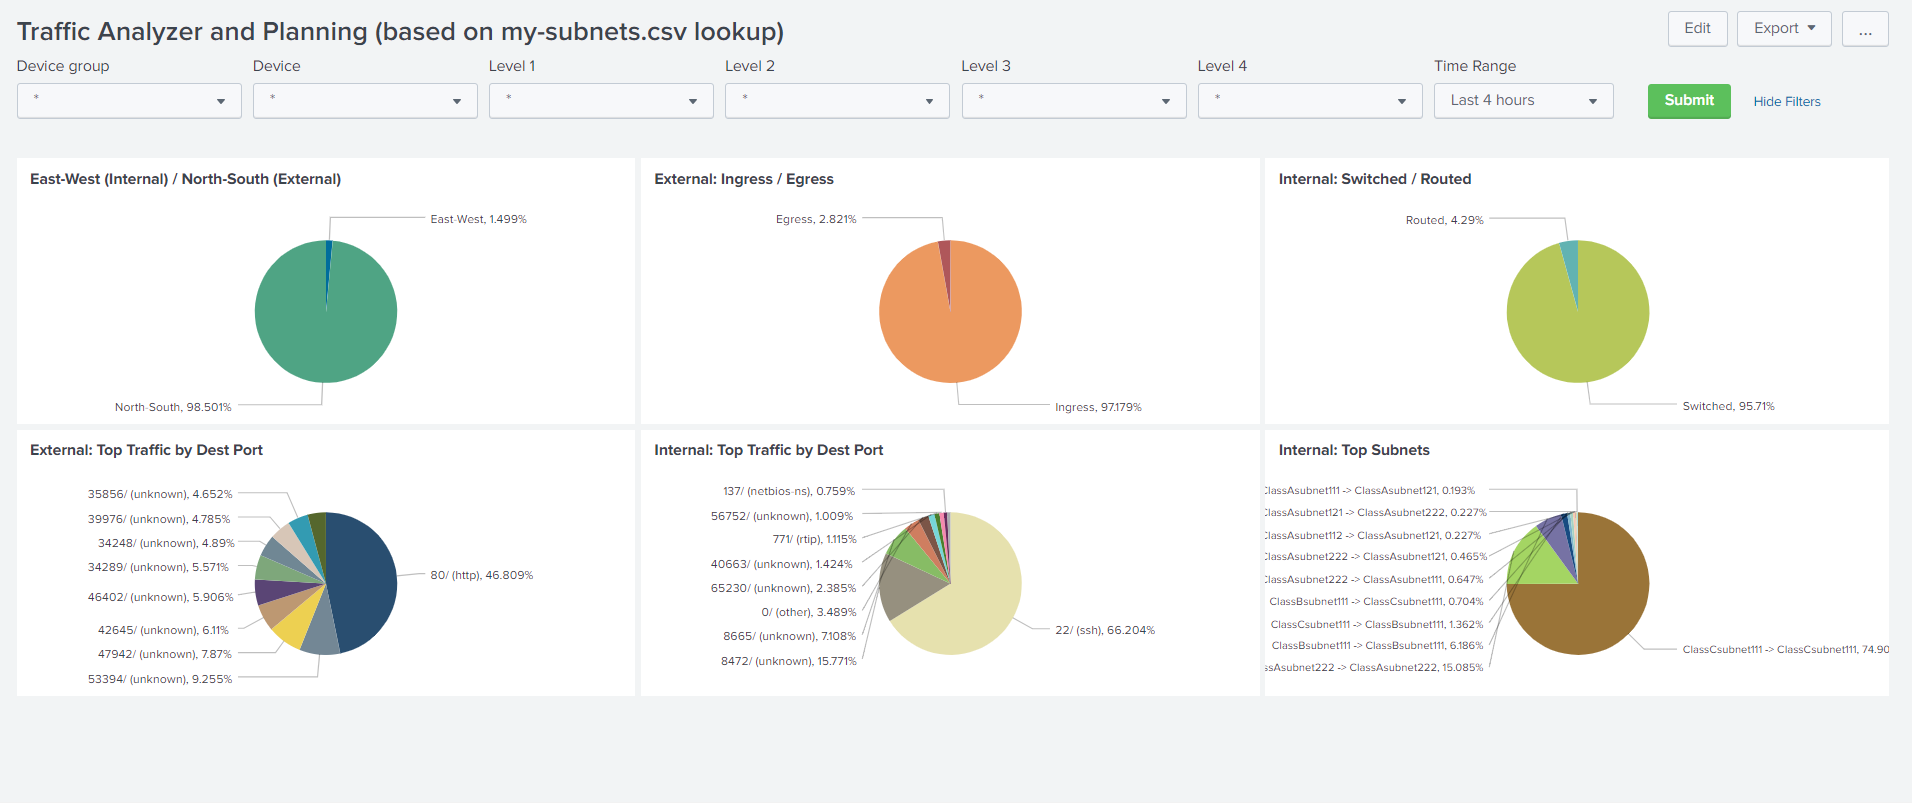 |
| TCP Health: Monitoring and detecting top hosts with the most TCP Resets. |  |
4. SNMP & Health (NetOps)
Technical views focused on hardware status, protocol performance, and overall network health.
| Dashboard Description | Click to Zoom |
|---|---|
| Network Topology with Insights: This dashboard visualizes your network topology based on devices and their connections automatically discovered through SNMP. Clicking on a device node in the topology diagram opens a detailed drill-down panel, which displays information about the selected device's interfaces, inluding vital statistics: Errors, discards, and relative load. | 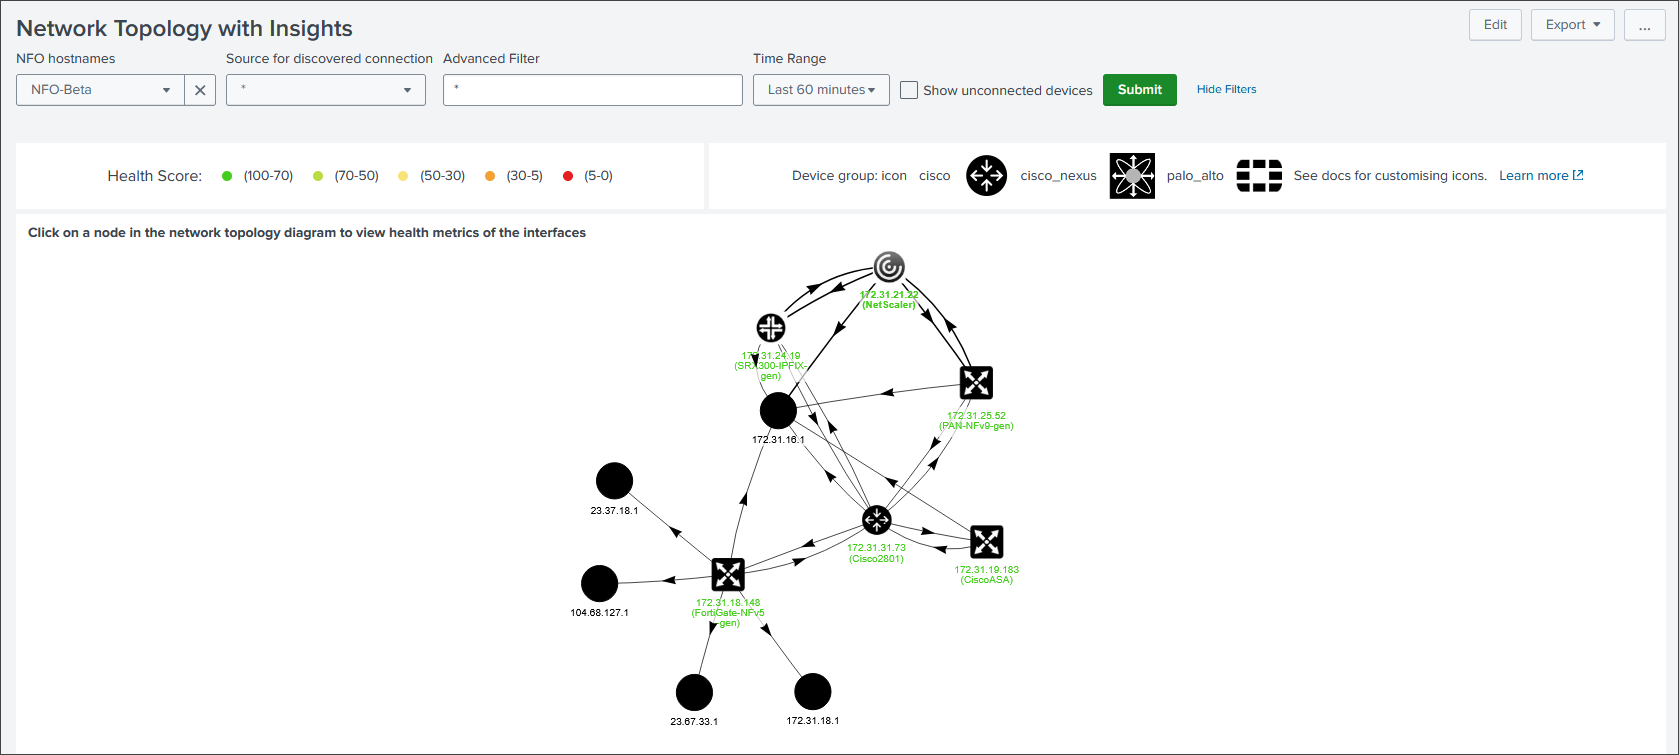 |
| Network Topology Drilldown: Clicking on a device node in the topology diagram opens a detailed drill-down panel. | 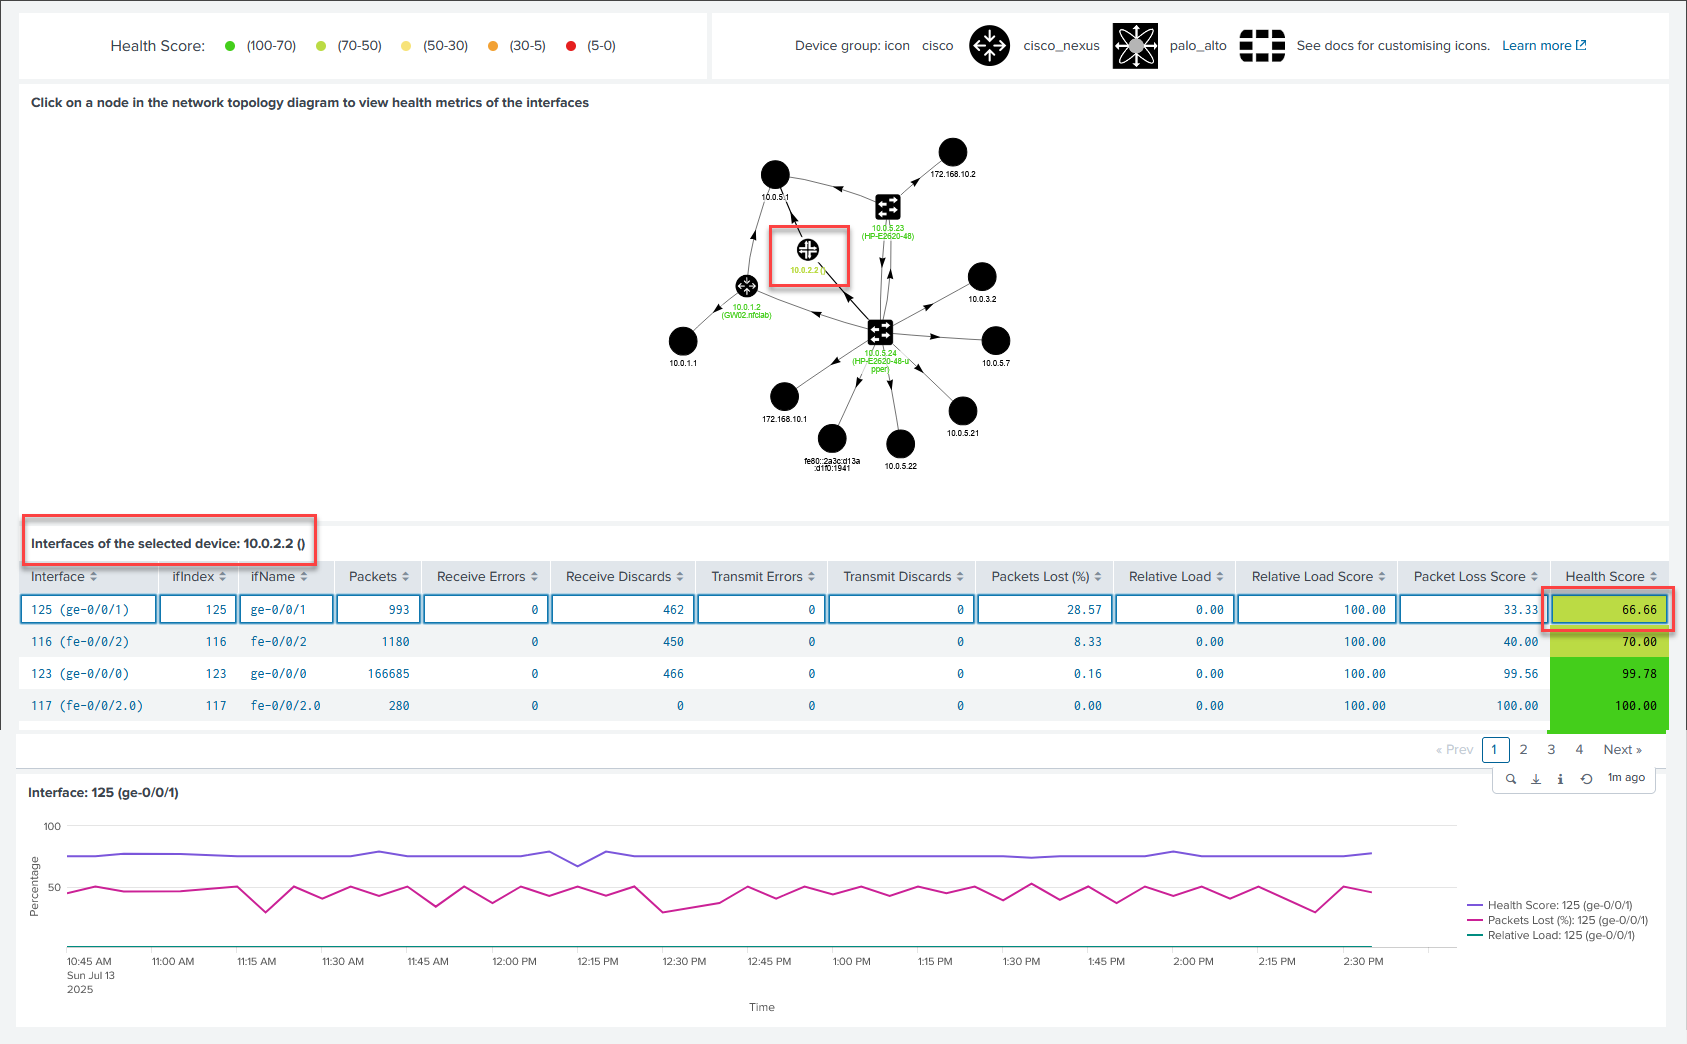 |
| Network Device Health: Color-coded scoring based on packet loss and relative load. | 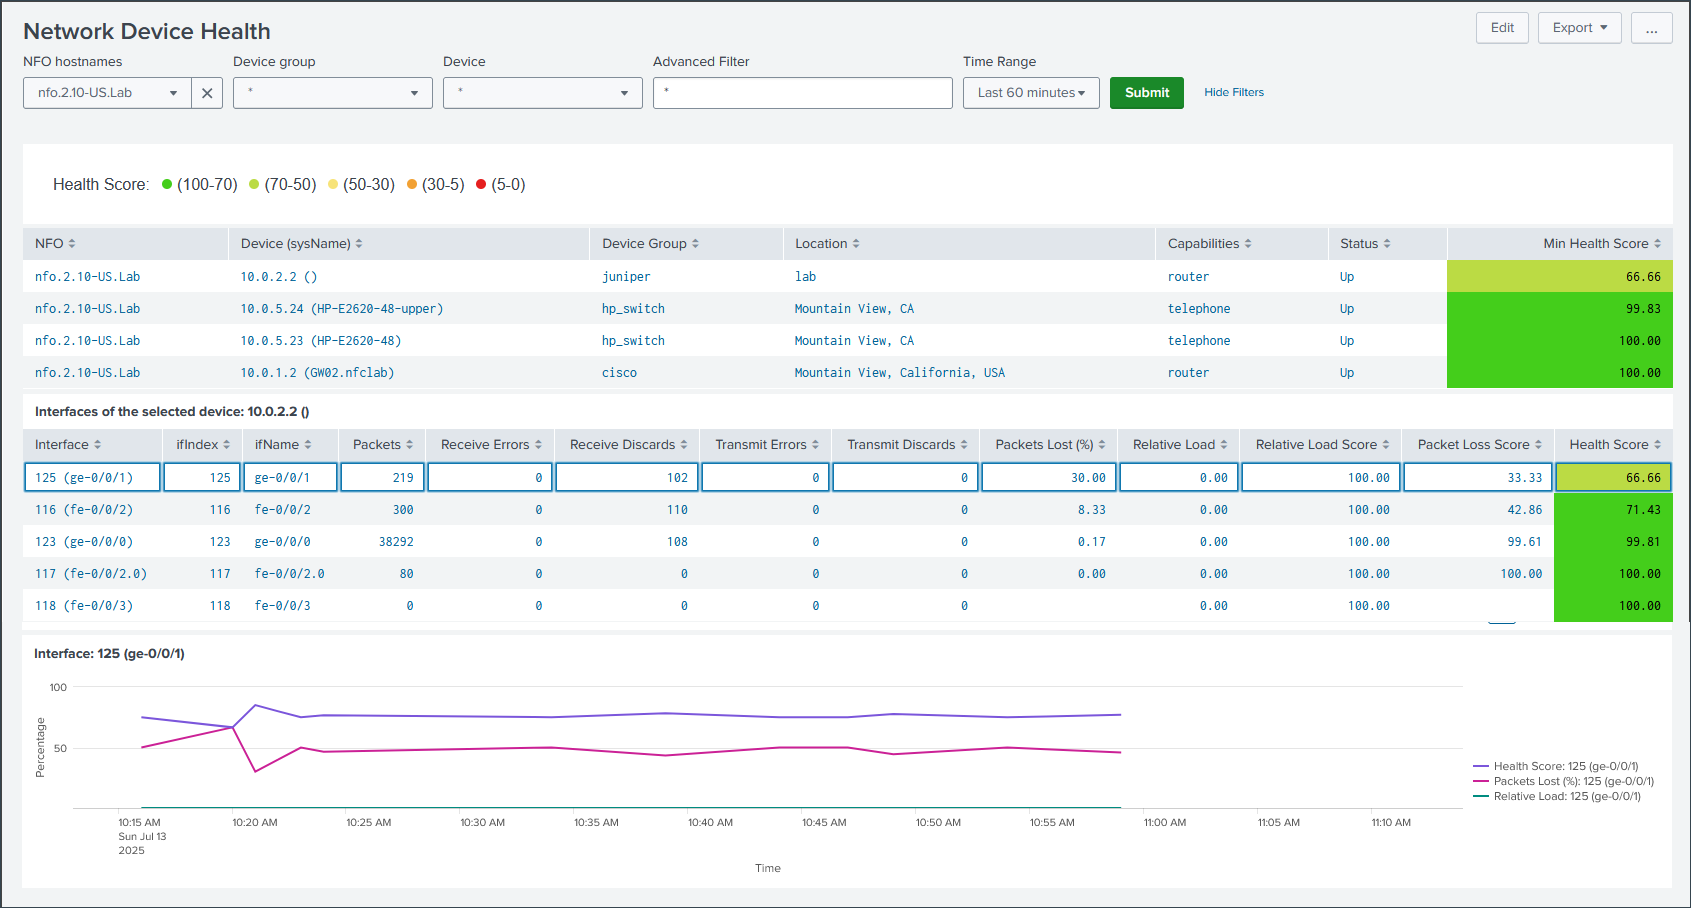 |
| Interface Errors and Discards: Identification of hardware-level drops and transmission issues. | 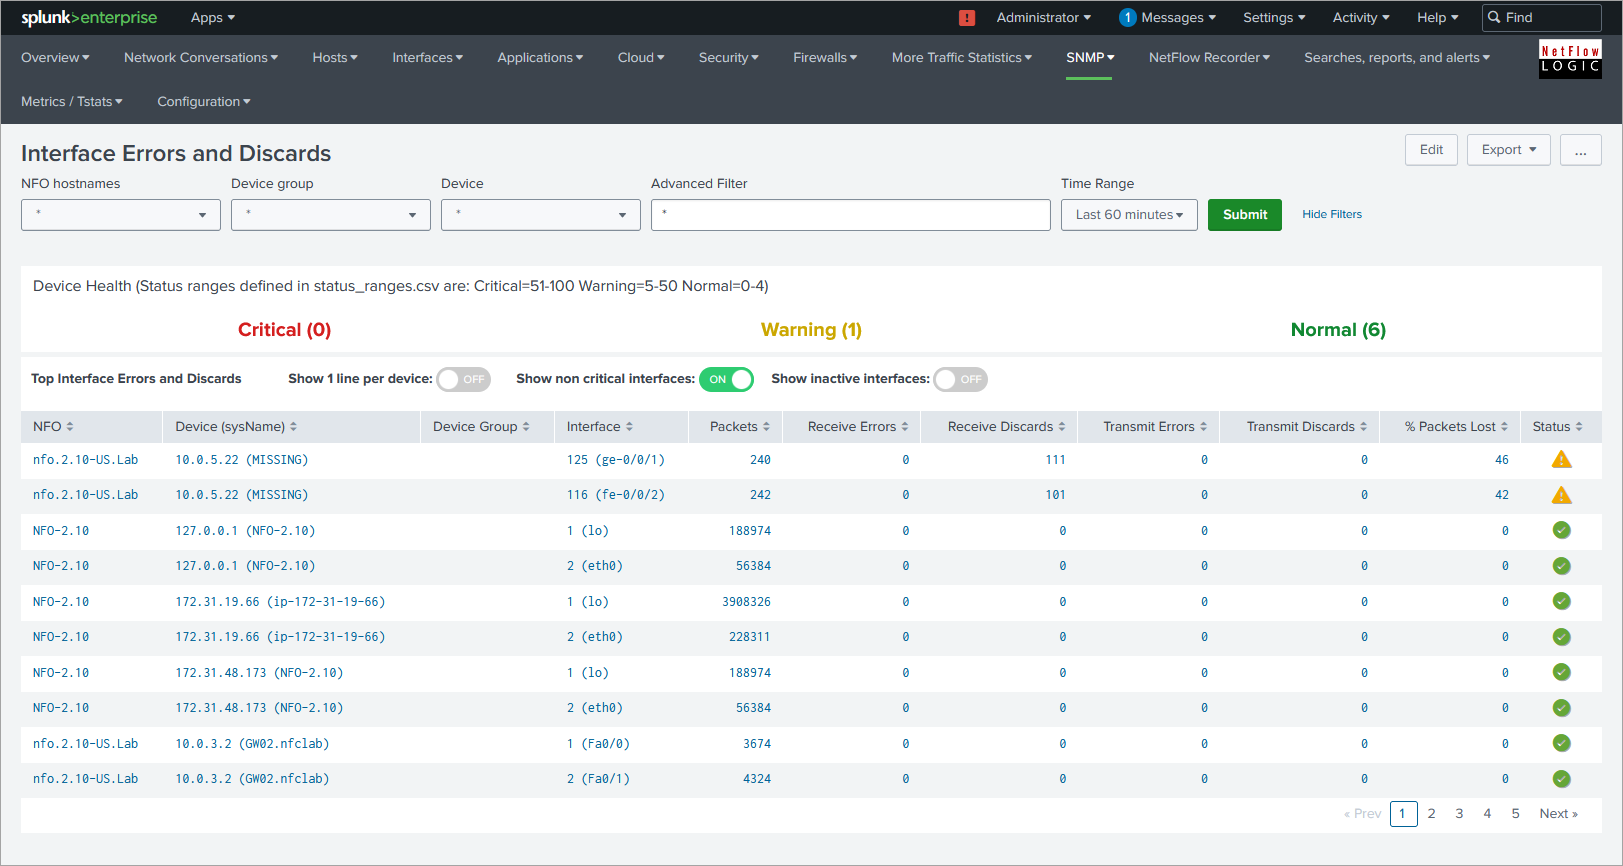 |
| SNMP Devices CPU and Memory: Monitoring of CPU, Memory, and Temperature for supported hardware. |  |
If you are looking for vendor-specific dashboards for AWS, Azure, GCP, or Cisco ASA, these have been consolidated into the Network Conversations dashboard to provide superior performance and bidirectional data stitching.