NetFlow App Reference
The NetFlow App for Sumo Logic provides immediate visibility into bandwidth usage, capacity planning, and cyber threat detection. This page serves as a reference for the pre-built dashboards included in the app.
1. Traffic Overview Dashboard
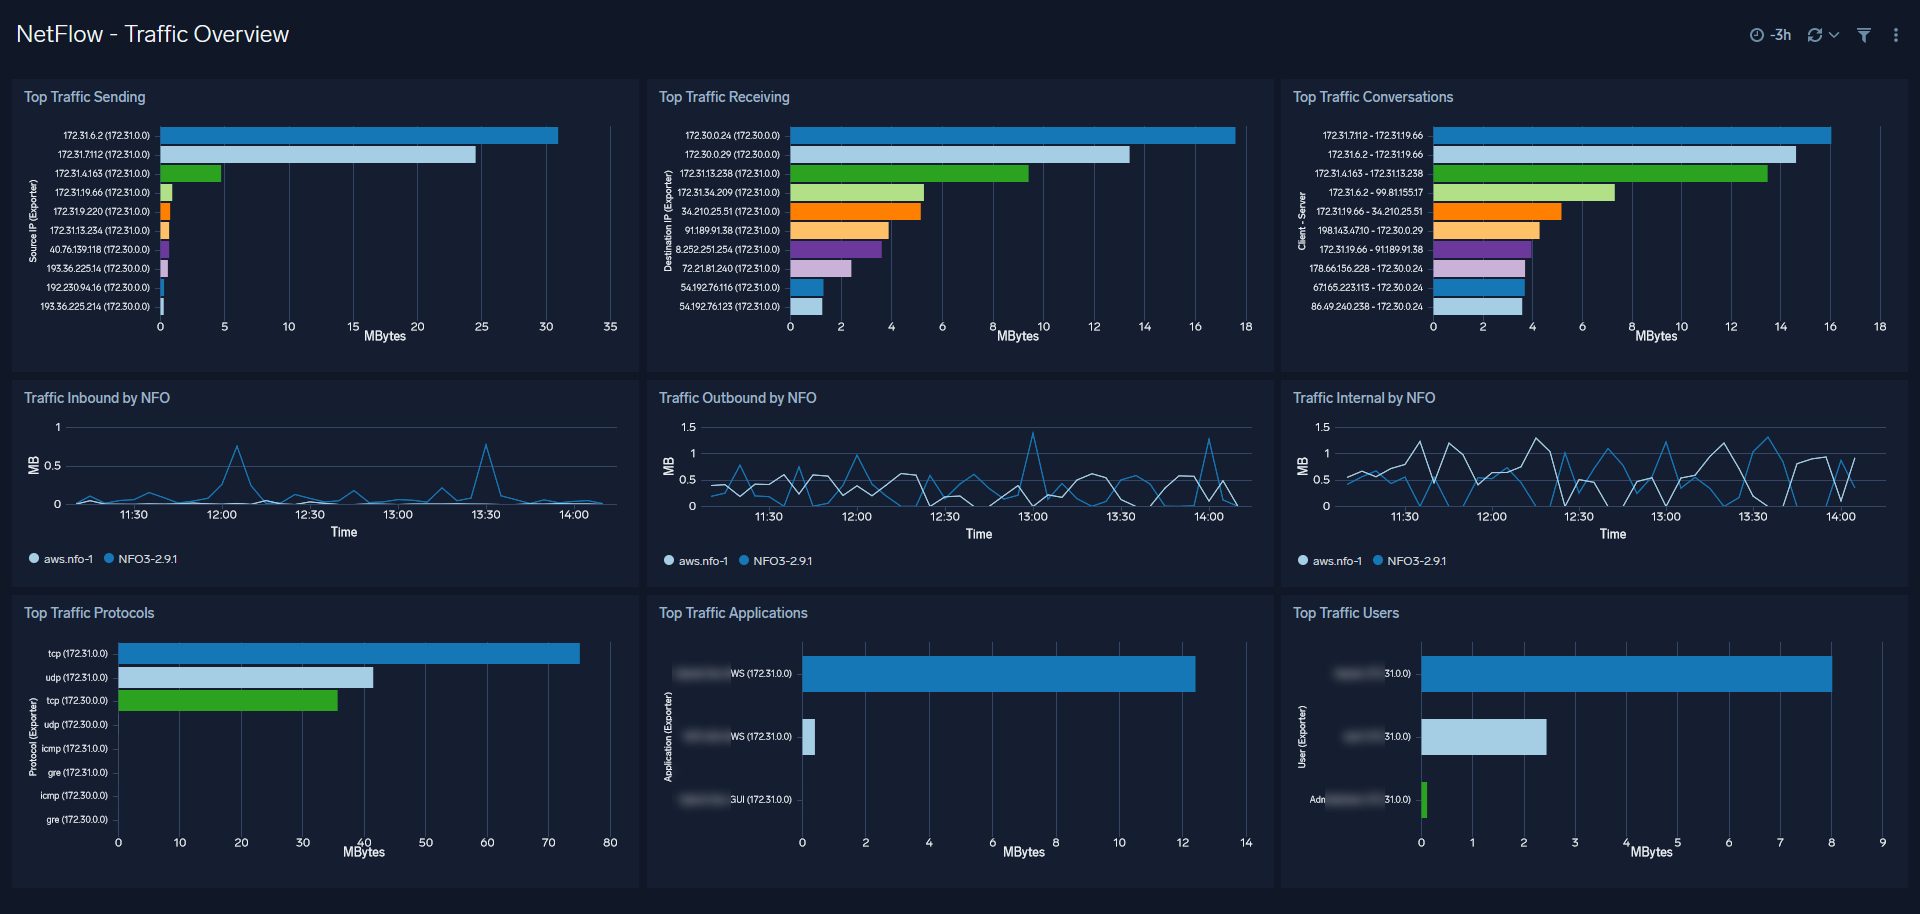
This dashboard is the primary tool for monitoring network performance and identifying utilization trends across your infrastructure.
- Top Talkers: Identify the top source and destination IP addresses or hostnames by traffic volume.
- Protocol & Application Analysis: View a breakdown of traffic by TCP/UDP ports and recognized applications.
- Volume Trends: Monitor total bytes transferred over time to identify anomalies or capacity bottlenecks.
2. Security Monitoring: Malicious Hosts
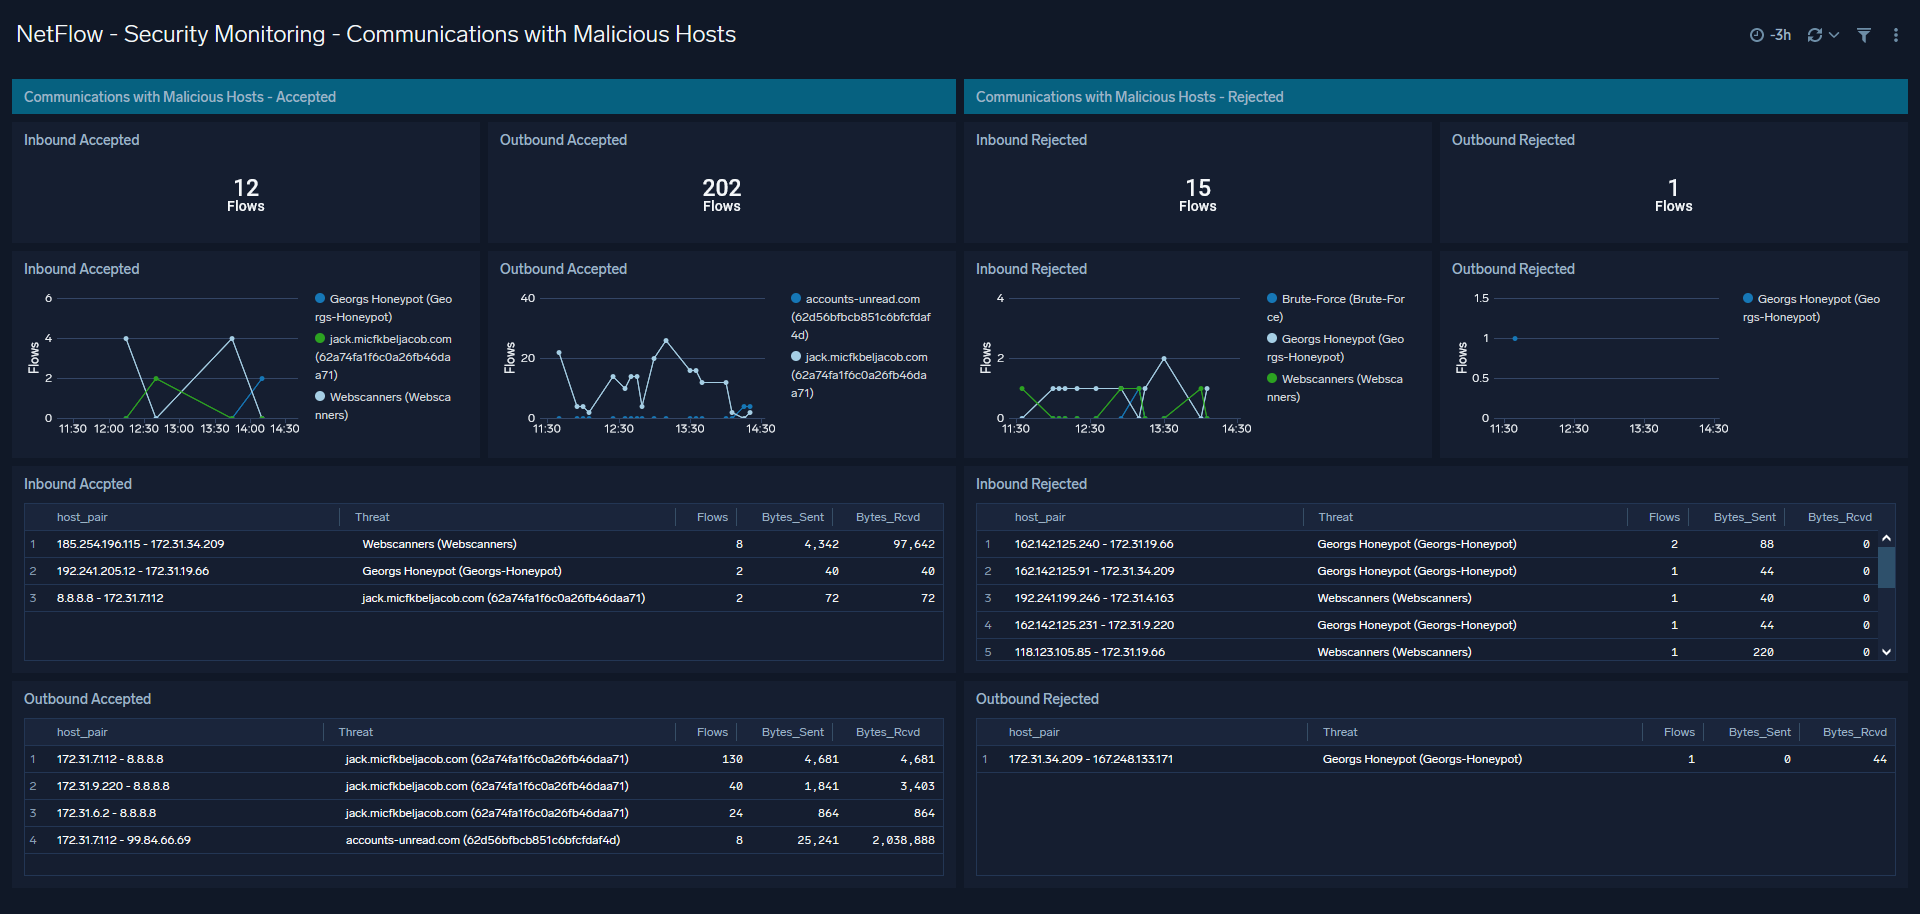
This dashboard focuses on high-risk network activity by correlating your flow data with threat intelligence.
- Threat Intelligence Correlation: Automatically flags communications with known malicious IP addresses.
- Geographical Distribution: A map view of traffic originating from or destined for high-risk geographic regions.
- Severity Levels: Prioritize investigations based on the reputation score provided by NFO enrichment.
3. Security Monitoring: Critical Ports
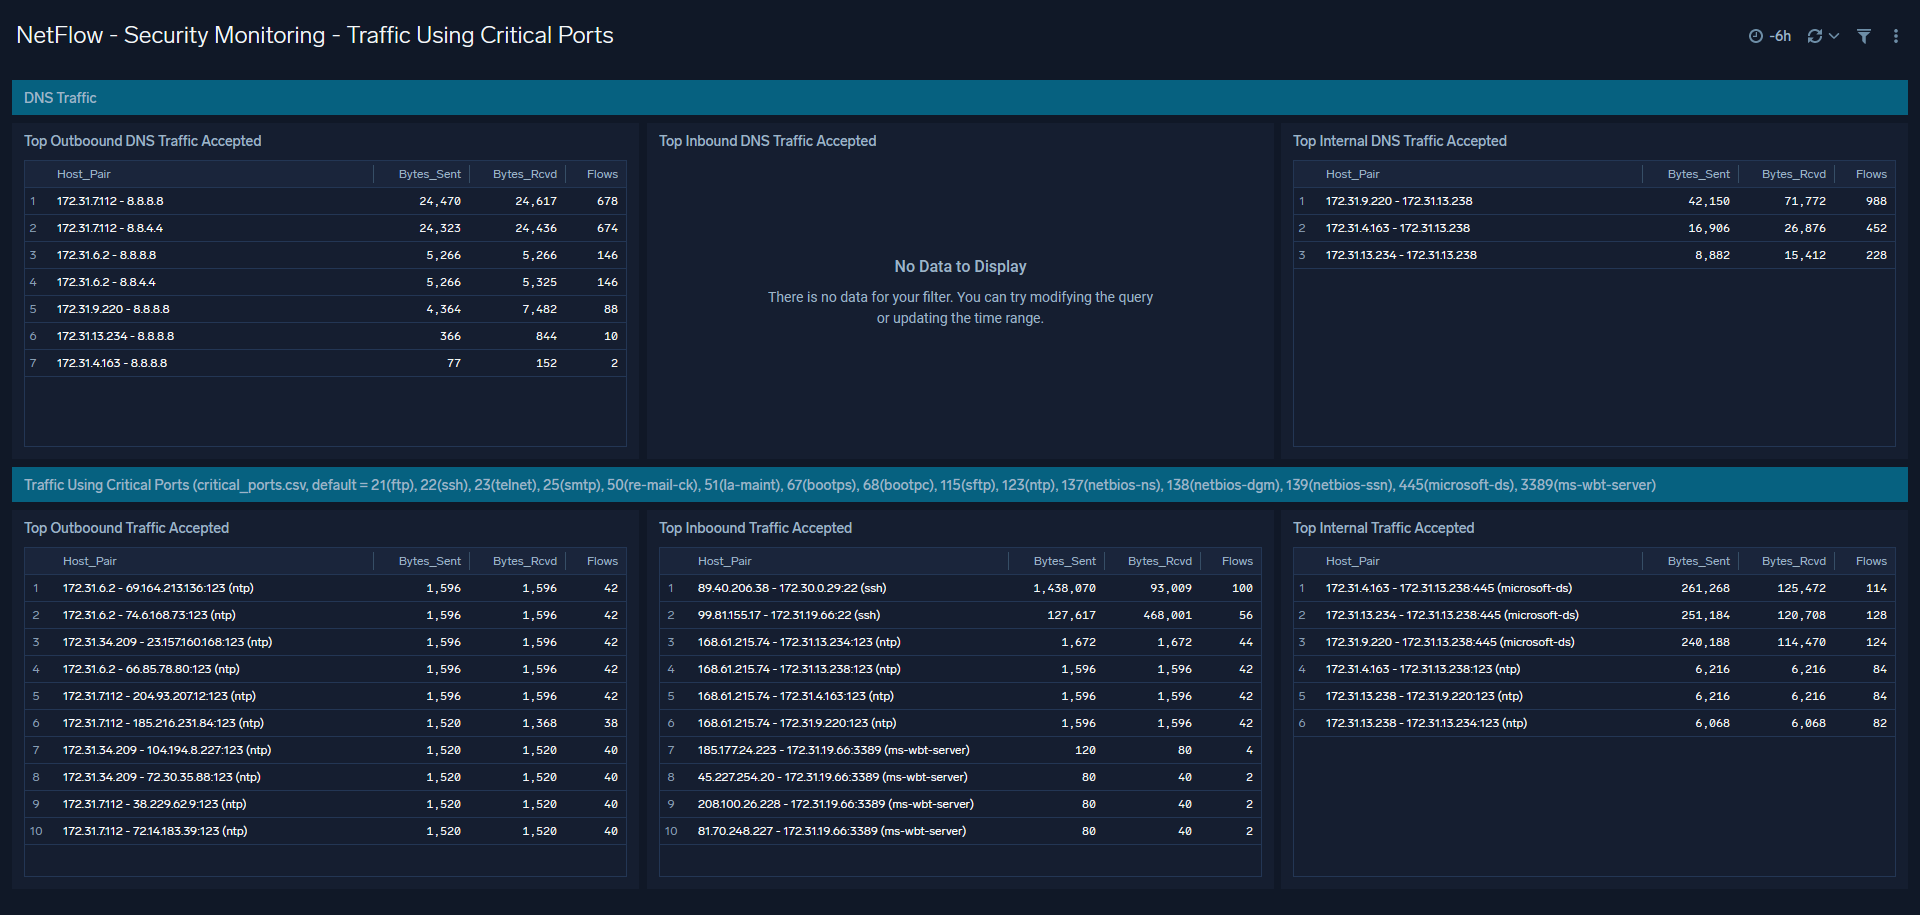
Focuses on unauthorized access and the health of core network services.
- Service Auditing: Monitor usage of critical management ports such as SSH (22), RDP (3389), and Telnet (23).
- DNS Analytics: Visualize DNS query volumes and identify potential DNS tunneling or exfiltration attempts.
- Unusual Port Activity: Detect traffic on non-standard ports that may indicate malware or shadow IT.
4. Flows Allowed and Rejected
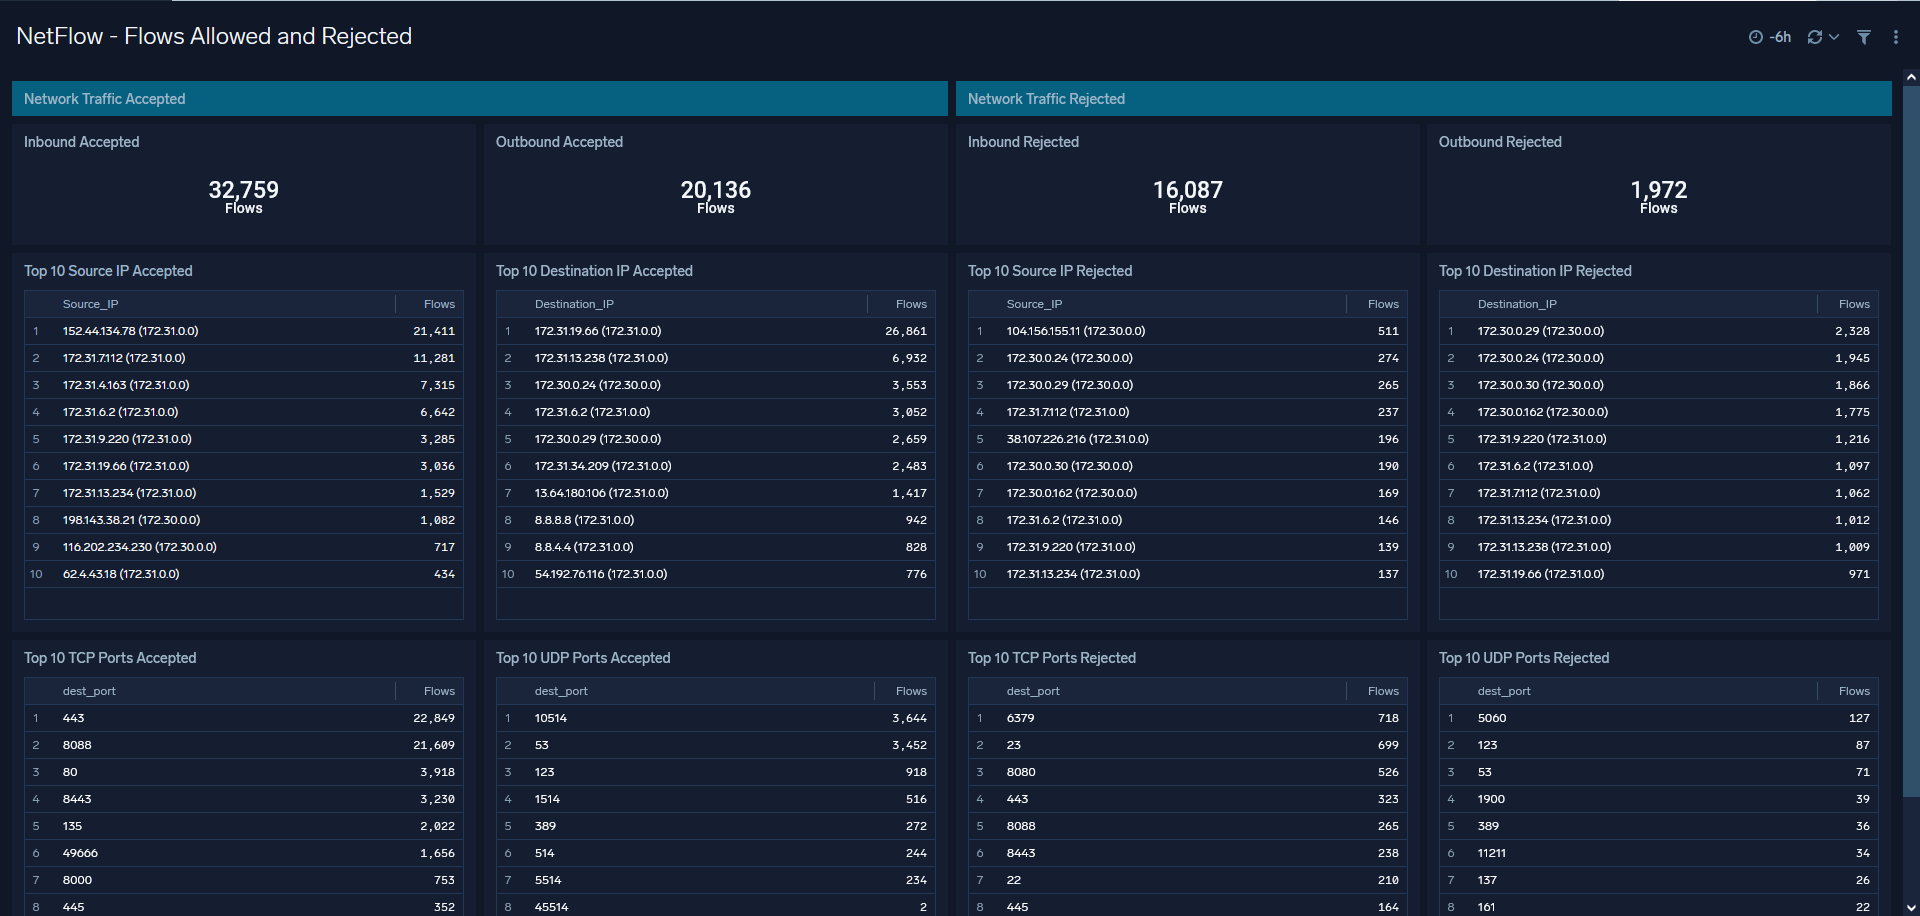
This dashboard provides a clear view of your security policy effectiveness by analyzing firewall and security group logs.
- Policy Validation: See a side-by-side comparison of accepted vs. rejected traffic.
- ACL Effectiveness: Identify which access control rules are being triggered most frequently.
- Rejected Traffic Spikes: Quickly spot bursts of rejected traffic that may indicate a scanning or brute-force attack.
Configuring Lookup Files
The NetFlow App relies on two lookup files to map protocol numbers to names and to identify critical ports. To ensure your dashboards display human-readable data, you must upload these files to your Sumo Logic environment and update the corresponding dashboard queries.
1. Download the Lookup Files
- critical_ports.csv: Maps port numbers to service names.
- netflow_protocols.csv: Maps protocol IDs to names (e.g., 6 to TCP).
2. Upload to Sumo Logic
- In the Sumo Logic portal, create a new directory (e.g.,
netflow_lookups). - Upload both CSV files as new Lookup Tables.
- Set the Primary Key for each table:
- critical_ports: Select
dest_port. - netflow_protocols: Select
protocol.
- Note the Path for both lookup files in your library.
3. Update Dashboard Queries
Because the App defaults to external links, you must manually point the following queries to your new local paths:
For "NetFlow - Security Monitoring - Traffic Using Critical Port"
Locate the queries for Top Inbound, Top Outbound, and Top Internal Traffic Accepted. Replace the default S3 URL with your local critical_ports path:
- Replace:
https://sumologicnetflow.s3.eu-central-1.amazonaws.com/critical_ports.csv - With:
path/to/your/local/critical_ports
For "NetFlow - Traffic Overview"
Locate the Top Traffic Protocols query and replace the default protocol URL:
- Replace:
https://sumologicnetflow.s3.eu-central-1.amazonaws.com/netflow_protocols.csv - With:
path/to/your/local/netflow_protocols