NetFlow Setup Guide
This guide walks you through the foundational building blocks of a NetFlow Optimizer (NFO) deployment. By the end of this tutorial, you will have assembled a complete end-to-end data pipeline: Source → Processing Engine → Destination.
Overview of Concepts
Before moving data, it's helpful to understand the NFO "Processing Path":
- Inputs (Sources): Where raw NetFlow enters the system (e.g., UDP 9995) or Cloud Flow logs.
- Modules (The Brain): The logic that transforms raw packets into optimized "conversations."
- Outputs (Destinations): The final stage of the pipeline where high-fidelity, volume-reduced data is streamed to your downstream platforms—such as a SIEM, Data Lake, or messaging bus — for visualization, proactive alerting, and AI-driven analysis.
Before You Begin
A successful setup starts with a prepared environment. Ensure the following are in place:
- System Readiness: NFO must be installed and the service status should be "Running." Refer to the NFO Installation Guide for single instances or the NFO Deployment Guide for distributed architectures.
- Network Path: Firewalls must allow UDP 9995 (Ingestion) and TCP 8443 (Management UI). See Network & Firewall Requirements.
- Telemetry Export: Your network hardware (Cisco, Juniper, etc.) must be configured to "push" flow records to the NFO IP address.
Step 1: Access the Interface & Verify Health
First, ensure the platform is healthy and authorized to process data.
- Navigate to
https://<nfo-host>:8443and log in. - Check License: Navigate to Licensing. A valid license is required for the engine to output data.
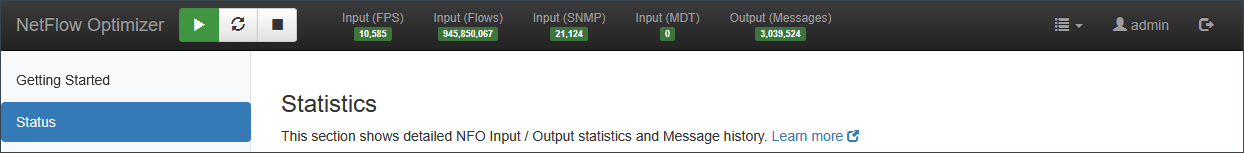
- Check System Status: Look at the health indicators in the top header to ensure the engine is ready.
Step 2: Configure the Ingestion Point (Inputs)
NFO needs a designated "front door" to receive your network's telemetry.
- Open Input Settings: Navigate to Inputs.
- Verify Default: You will see a pre-configured input on UDP port 9995.
- Add Custom Inputs: If your devices send data on non-standard ports, click the + sign and specify the port number.
- Listen: Once saved, NFO begins listening for incoming packets on these ports immediately.
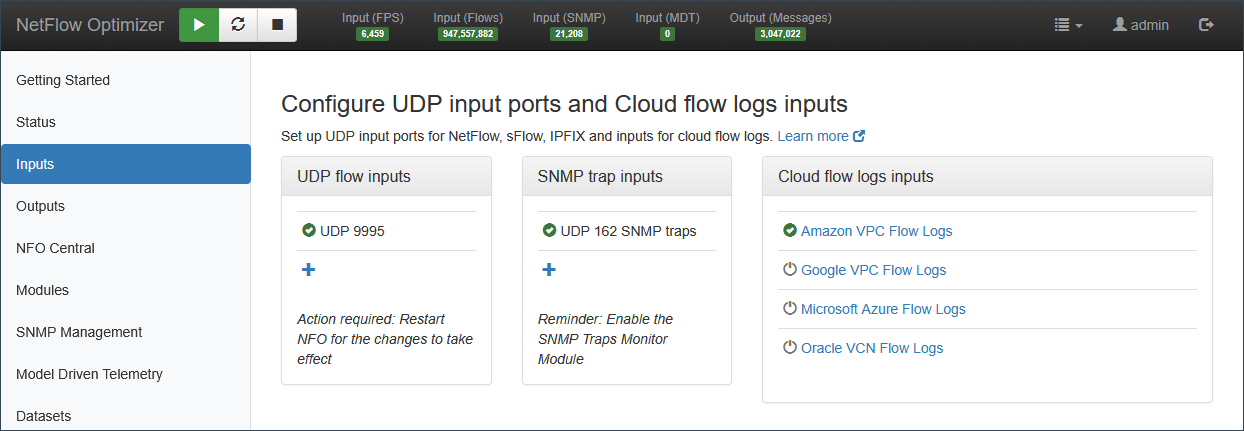
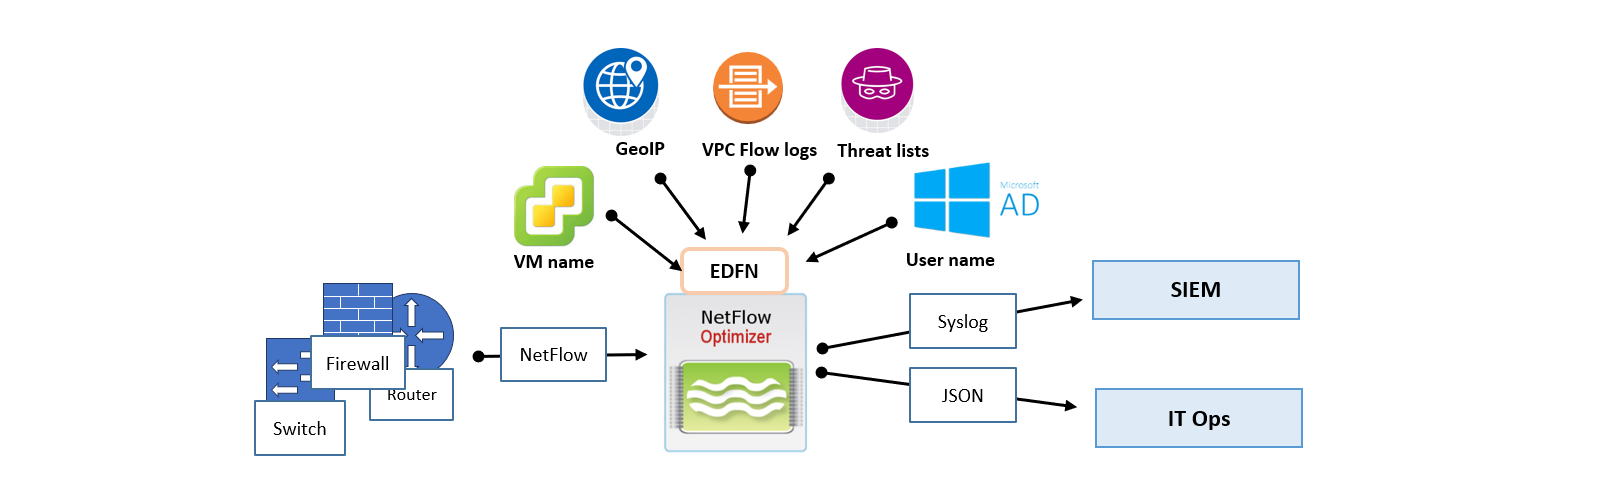
If you are ingesting AWS, Azure, GCP, or Oracle (OCI) flow logs, you will likely use the External Data Feeder (EDFN). See the Cloud Ingestion for specific setup steps.
Step 3: Define Processing Logic (Modules)
Unlike a basic collector, NFO processes data through "Modules." This is where deduplication, flow aggregation, enrichment, and "stitching" occur.
-
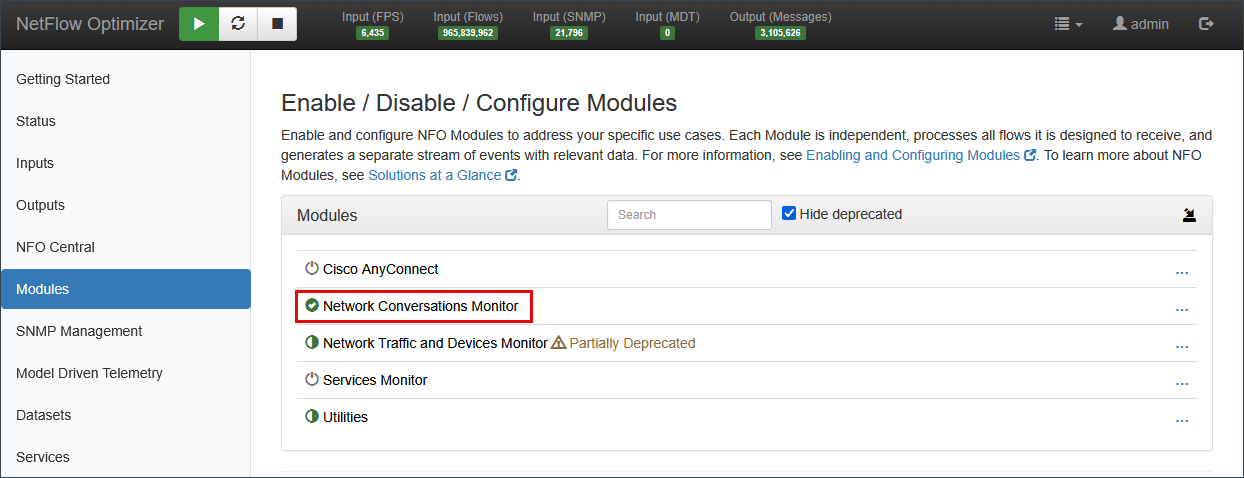
Navigate to Modules: Click Modules in the sidebar.
-
Choose Your Logic:
- Top Traffic Monitor: Best for high-level volume reduction and identifying top bandwidth consumers. It offers the flexibility to report either "Top Talkers" or "All Traffic" while maintaining efficient flow aggregation.
- Network Conversations Monitor: (Recommended) Best for security and forensics; it stitches unidirectional flows into bi-directional "conversations." This module significantly reduces volume while enriching data with critical context, including User Identity, VM names, Security Reputation, and Applications.
Decision Support:Which module is right for you? If you are unsure which to choose, see our detailed comparison: Which Module to Choose: Top Traffic vs. Network Conversations.
-
Toggle to Enabled: Switch your chosen module to Enabled and click Save.
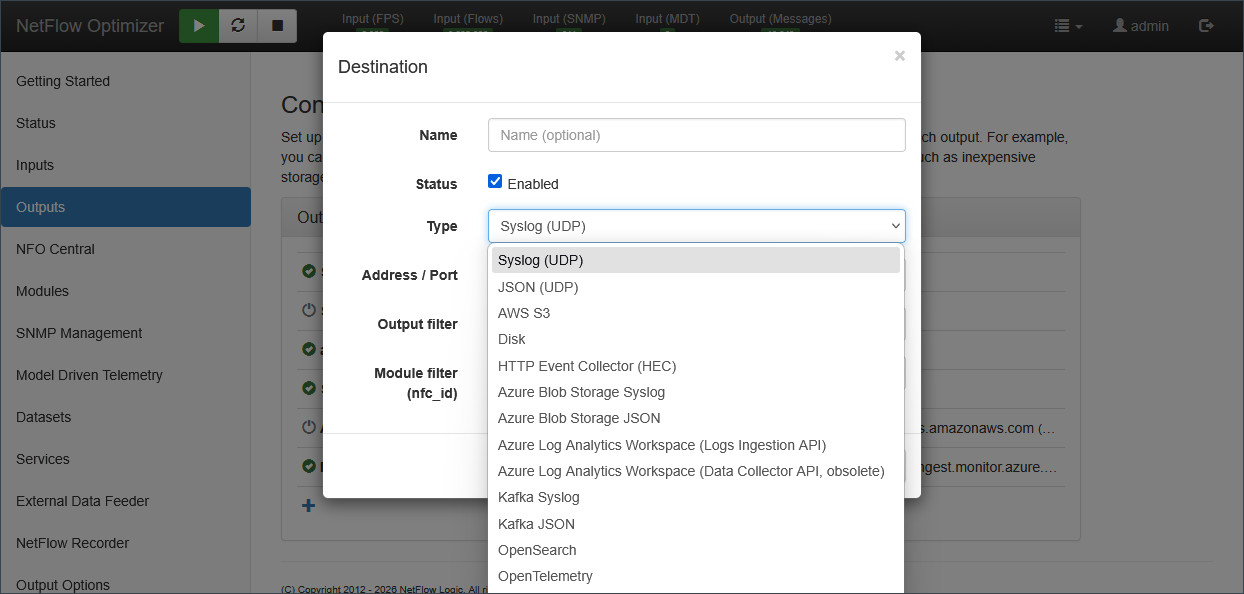
Step 4: Configure Destinations (Outputs)
To see your data, you must tell NFO where to send it. NFO supports multiple concurrent outputs.
- Add Output: Navigate to Outputs and click the + sign.
- Select Destination: Choose your target platform (e.g., Splunk HEC, Kafka, Microsoft Sentinel, or Syslog).
- Configure Connection: Enter the IP/URL and port of your receiver. If you are using Splunk (HEC) or CrowdStrike (HEC), you will also enter your authentication token or credentials.
NFO supports a wide range of output types. Common destinations include:
- SIEMs: Splunk, Microsoft Sentinel, IBM QRadar, Google Chronicle.
- Data Lakes & Platforms: Kafka, Elasticsearch/OpenSearch, Amazon S3, Azure Monitor.
- Standard Protocols: Syslog (BSD/IETF), JSON over TCP/UDP, and Prometheus.
For a complete list of supported output types and their specific parameters, see the Output Types.
- Save and Deploy: Once saved, the pipeline is active. Processed data will begin flowing to your destination in real-time.
Step 5: Add Context to Flow Data
You have now built a basic NFO pipeline. Data is being ingested, optimized for volume, and delivered to your SIEM.
- Enrich Your Data: Now that the pipeline is active, go to Data Enrichment to add User Identity, Reputation, and Geolocation context to your flows.