SNMP Setup Guide
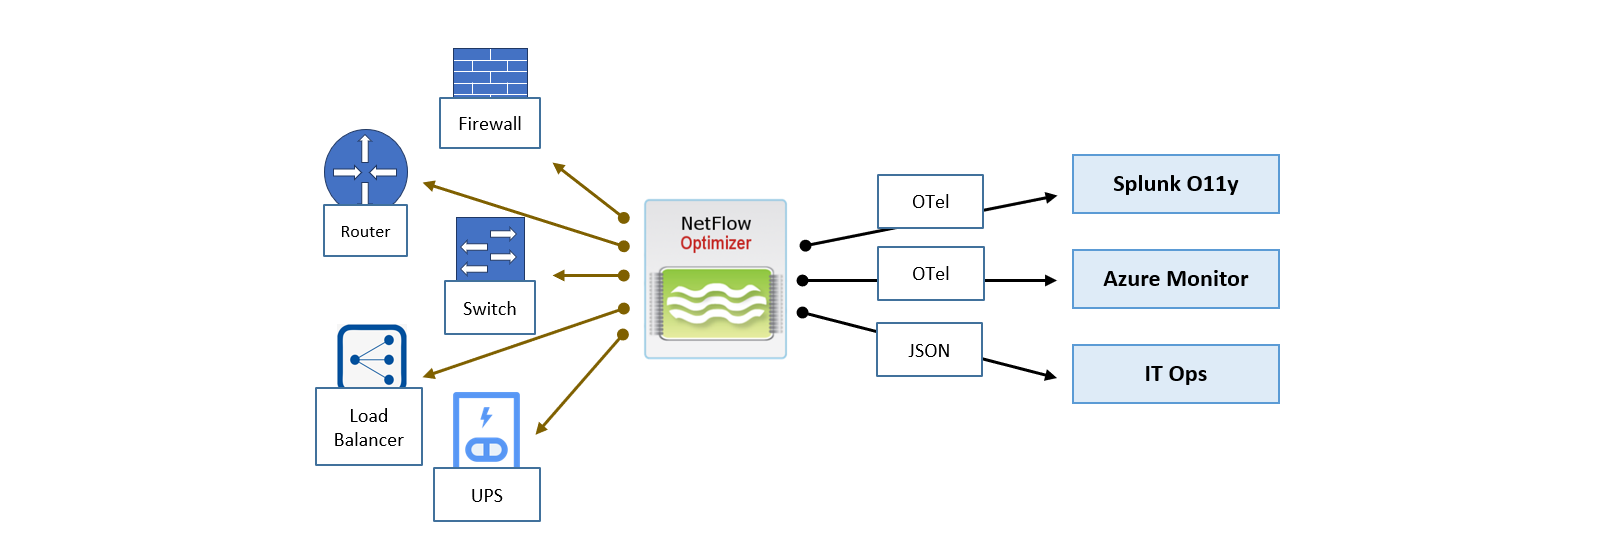
While NetFlow tells you who is talking, SNMP tells you why your network might be struggling. By combining flow data with device-level health metrics (CPU, memory, and interface status), NFO provides a 360-degree view of your infrastructure.
NFO leverages the Simple Network Management Protocol (SNMP) to collect vital performance data, network details, and alerts from your devices. As part of your current NFO license, you are entitled to SNMP Basic, which offers foundational monitoring to complement your NetFlow visibility.
For advanced security (SNMPv3), automation, and large-scale management, we offer the SNMP Pro tier. For a full feature breakdown, see Feature Tiers and Protocol Access.
Step 1: Configure Credentials
Provide NFO with the authentication details it needs to communicate with your devices.
- Navigate to SNMP Management > Credentials.
- Add your devices' SNMPv2c community strings or SNMPv3 security names.
- Click Save. NFO securely stores these for use during the discovery phase.
For the full credentials field reference, including SNMPv3 security levels, authentication protocols, and encryption options, see SNMP Credentials.
Step 2: Launch Auto-Discovery & Classification
NFO builds a dynamic inventory by probing your subnets or IP ranges and automatically identifying hardware types.
- Navigate to SNMP Management > Auto-discovery > SNMP auto-discovery EDFN agent.
- Define your IP Ranges on the Auto-discovery networks tab (e.g.,
10.0.0.0/24or192.168.20.1 - 192.168.20.24). - Verify via Dry Run: Click Dry run. NFO scans the range to identify hardware (Cisco, Juniper, Palo Alto, etc.). Switch to the Preview devices tab to see how NFO has automatically mapped devices to functional Device Groups.
- Commit to Inventory: Once satisfied with the classification results, go to the Settings tab and click Run now. This moves the discovered devices into your active monitoring inventory.
- Schedule Updates: Adjust the Cron schedule (default: twice a day) to ensure NFO automatically detects and re-classifies new equipment added to your network.
For advanced discovery options, including discovery modes (Full scan and Topology traversal), scan concurrency, SNMP GET timeouts, and per-subnet credential assignment, see Auto-Discovery.
Step 3: Enable the Collection Engine
Activate the logic that performs the actual polling.
- Navigate to Modules > Utilities.
- Locate SNMP Custom OID Sets Monitor (10103).
- Toggle to Enabled.
- Toggle to Enabled the OID sets that correspond to your discovered Device Groups.
Result: NFO begins polling CPU, Memory, and Interface metrics based on the hardware discovered in Step 2. No manual OID mapping required.
Step 4: Review and Override Classifications (Optional)
NFO automatically assigns Device Groups and a Device Type to each discovered device. In most environments this requires no changes. Review this if any devices were classified incorrectly. For example, a multi-purpose Layer 3 switch you want to treat strictly as a router, or a Linux host you want tagged as a security appliance.
- Navigate to SNMP Management > Auto-discovery > Classification Rules tab.
- Review the Device Group and Device Type assigned to your infrastructure.
- If a device needs a different classification, click Add Rule and define the override condition (e.g., match on
sysNamepatternNY-CORE→ assign Device Typerouter). - Click Save. Rules apply on the next discovery cycle.
For a full explanation of how Device Groups and Device Types work, and how multi-group inheritance is applied, see Understanding Multi-Group Inheritance.
Step 5: Configure Auto-Discovery Reporting (Optional)
Enable the Auto-discovery Reporter (Module 10701) to forward device discovery metadata (device inventory, topology connections, and classification changes) to your SIEM for asset management and network topology mapping.
- Navigate to Modules > Utilities.
- Locate Auto-discovery Reporter (10701).
- Toggle to Enabled.
For output field mapping and SIEM forwarding configuration, see Auto-discovery Reporter (10701).
Verifying Health & Success
Once polling is active, confirm everything is working:
- Device List: Navigate to SNMP Management > IPv4 Device List. Confirm your devices appear with their Type and Assigned Groups correctly identified.
- Polling Success: Check the NFO header for Skipped Requests. If this number is rising, check your firewall paths or verify that your community strings match the device configuration.
- Audit Logs: Navigate to the Status page and select the Logs tab for a real-time view of system activity.
Next Steps
You have a working SNMP pipeline. NFO is discovering devices, classifying them, and polling for health metrics.
- Receive Alerts: Set up SNMP Trap Inputs to ingest real-time hardware alerts from your devices.
- Customize Polling: Need to monitor a proprietary metric? See SNMP Custom OID Sets Monitor (10103).
- Advanced Configuration: For the full reference covering MIB uploads, interface overrides, polling rules, and unresponsive device handling, see SNMP Management.