Dashboards
The App includes two operational dashboards and an Alerts page that together cover real-time monitoring, forensic investigation, and alert management. The main dashboards share common NFO hostnames, Device / Virtual Network, and Confidence level filters, along with the standard Splunk Time range picker. See Operations — Confidence Levels for guidance on choosing the right threshold for your environment.
DDoS Attacks Summary
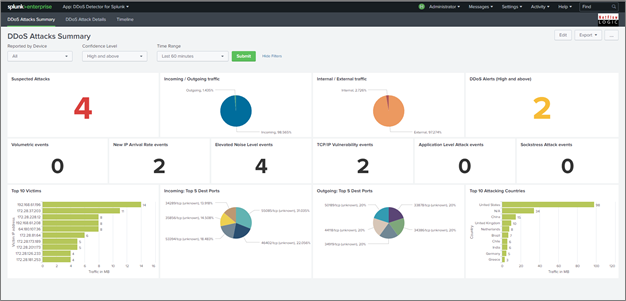
The DDoS Attacks Summary dashboard is the primary monitoring view. It gives operators a high-level picture of detected DDoS activity across the selected time range and confidence level.
Attacks by type shows the distribution of detected attack types within the selected filters. Each bar or slice represents one of the over 30 classified attack types, or a combination. Use this panel to identify whether your environment is seeing a concentration of one type or a mixed pattern.
Top victims lists the internal IP addresses or subnets most frequently targeted within the selected time range. Victim classification depends on the local subnets configured during installation -- ensure your subnet list is accurate for this panel to reflect your environment correctly.
Top attacking countries shows the geographic origin of attack traffic, derived from GeoIP enrichment applied by NFO before events are sent to Splunk.
DDoS Attacks Details
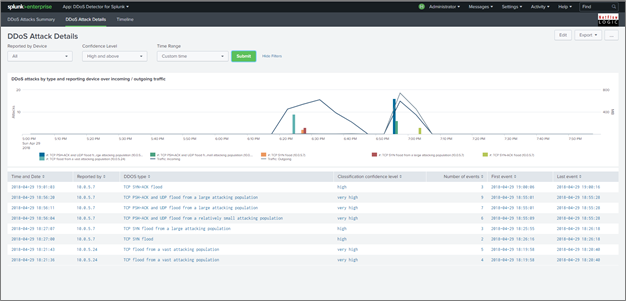
The DDoS Attacks Details dashboard provides a time-series view of individual attack events and the traffic context surrounding them. Inbound and outbound traffic volumes are plotted before and during each detected attack, making it straightforward to correlate the traffic spike with the detection event and assess the scale of impact.
Each row in the events table shows the detection timestamp, attack type, victim IP or subnet, source country, and the confidence level assigned by NFO.
Drilldown: Clicking any event opens detail panels for that specific attack:
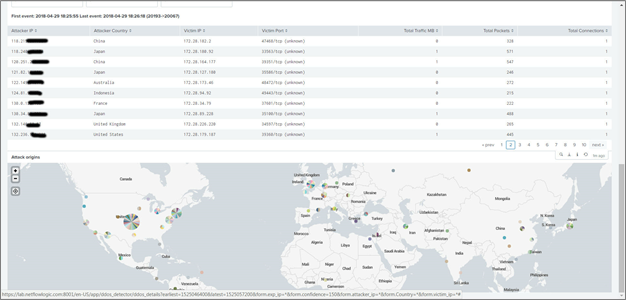
- Full breakdown of attack type components when a combination type is detected
- Traffic volume detail for the affected victim
- Source IP and country distribution for the attack traffic
Use the drilldown to gather the information needed for mitigation — source ASNs, targeted ports, and attack duration are all available at this level.
Alerts
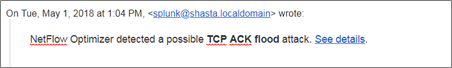
The App includes a pre-built saved search called ddos_alert that triggers email notifications when a qualifying DDoS event is detected. When results match the trigger condition, Splunk sends an email containing a summary of the event and a See details link that opens the DDoS Attacks Details dashboard pre-filtered to that alert.
The ddos_alert saved search is disabled by default. Before email notifications will be sent, enable it and confirm that Splunk email settings are configured for your environment.
To configure recipients and trigger conditions:
- In the DDoS Detector App, open the Alerts page or go to Splunk's Searches, Reports, and Alerts page
- Edit the
ddos_alertsaved search - Under Trigger Conditions, set the minimum confidence level for notifications
- Under Actions, add recipient email addresses to the To field
- Enable the alert if it is currently disabled, then click Save
If dashboard filter dropdowns appear empty immediately after installation, wait for the scheduled searches that populate the lookup-backed filter values to run, or trigger those searches manually during initial setup.