Status
The Status page is the primary operational dashboard for NetFlow Optimizer. It provides real-time visibility into system health, data pipeline throughput, and SNMP polling activity — and is the first place to check when investigating unexpected behavior.
Navigate to Status in the NFO web interface.
Statistics Tab
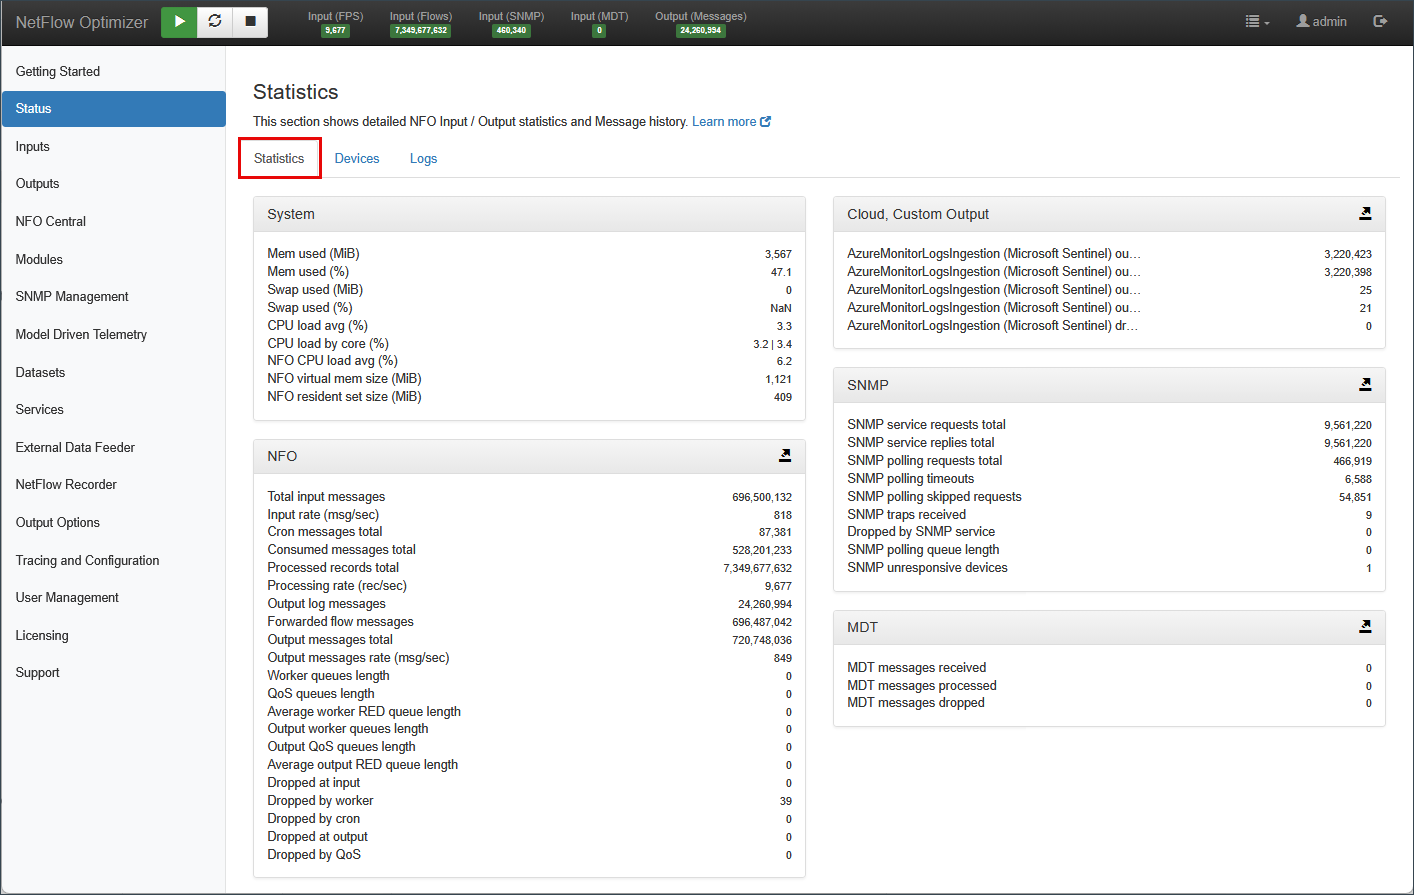
The Statistics tab displays four monitoring panels updated in real time.
System Panel
Shows the health of the NFO host machine — memory usage (used MiB and percentage), swap usage, CPU load average, per-core CPU load, and NFO process-specific metrics including virtual memory size and resident set size.
If CPU or memory utilization is consistently high, consider adding NFO peer instances. For details, visit NFO Central.
NFO Panel
Shows throughput and drop statistics for the NFO data pipeline — input rates (total messages, msg/sec), cron and consumed message totals, processed records and processing rate, output log and forwarded flow message counts, output message totals and rates, queue lengths across worker, QoS, and output stages, and per-stage drop counters (input, worker, cron, output, QoS).
A small number of drops on restart is normal while NetFlow v9/IPFIX templates are being re-established. Persistent or growing drop counts indicate a configuration or capacity issue. For diagnosis, see Data Quality & Performance.
SNMP Panel
Shows the health of the SNMP polling service — service request and reply totals, polling request counts, timeouts, skipped requests, traps received, drops, queue length, and unresponsive device count.
The key indicators to watch are polling timeouts and skipped requests. A growing timeout count suggests network latency or device unavailability. Skipped requests reflect devices currently on the inactive suspension list.
For details on device suspension behavior, see Suspending SNMP Polling from Inactive Devices.
MDT Panel
Shows throughput for the Model Driven Telemetry pipeline — messages received, processed, and dropped.
Cloud / Custom Output Panel
Shows per-destination output statistics for each configured cloud or custom output — records generated, records sent, current queue length, queue size in KB, and dropped records. One block of metrics appears per active destination (e.g., Microsoft Sentinel, AWS OpenSearch, Syslog).
The key indicator is dropped — any non-zero drop count means records are being lost before delivery, typically due to queue overflow or a connectivity issue with that endpoint.
Devices Tab
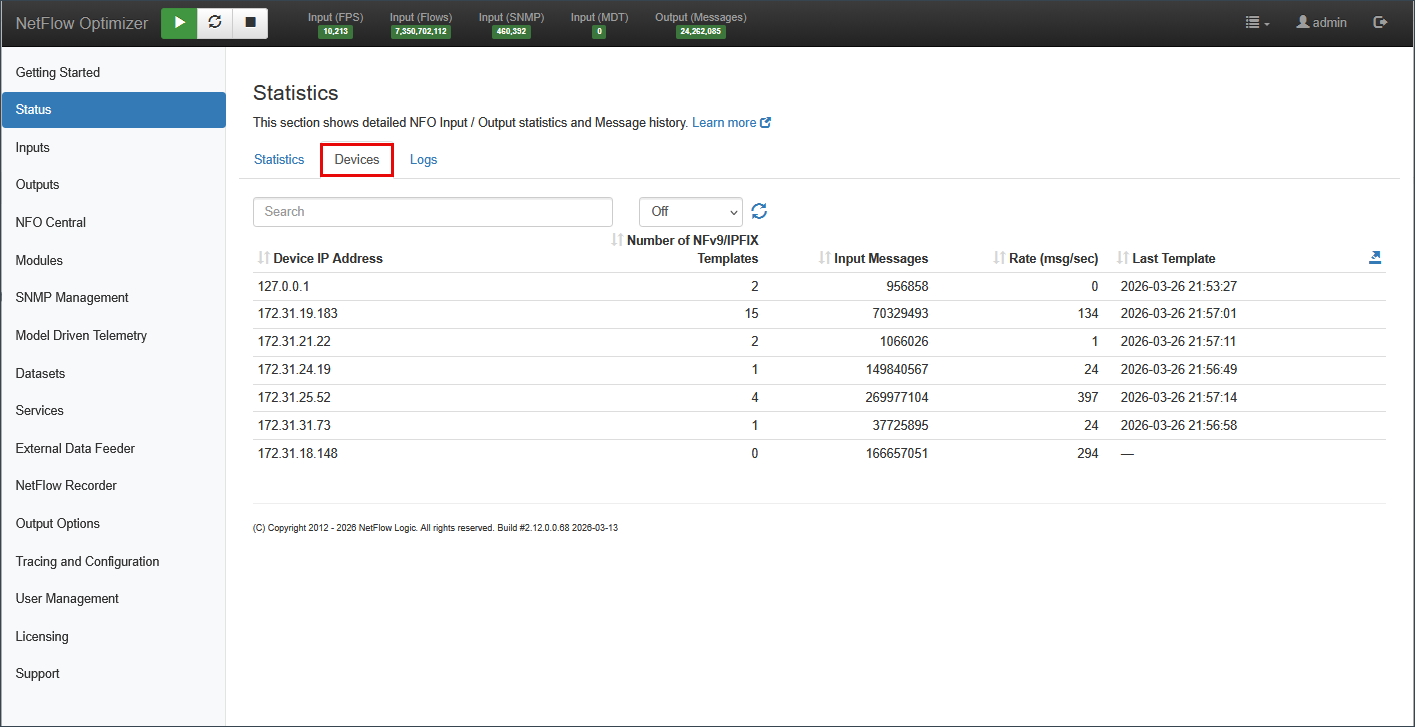
The Devices tab lists all active NetFlow exporters — network devices currently sending flow data to NFO — along with their template and throughput statistics. The list is searchable and supports auto-refresh via the interval selector.
| Column | Description |
|---|---|
| Device IP Address | Source IP address of the flow exporter |
| Number of NFv9/IPFIX Templates | Count of NetFlow v9/IPFIX templates received from this exporter. A value of 0 means no templates have been received yet — flow records from this device may not be decoded correctly |
| Input Messages | Cumulative count of flow messages received from this exporter |
| Rate (msg/sec) | Current message ingestion rate from this exporter |
| Last Template | Timestamp of the most recently received template from this exporter. A dash indicates no template has been received |
Use this tab to verify that all expected exporters are actively sending data. A missing exporter, a zero template count, or a stale Last Template timestamp indicates a connectivity or configuration issue on the network device. See Connectivity & Firewalls for diagnosis steps.
Logs Tab

The Logs tab shows the live NFO message history — system events, warnings, and errors generated by the NFO engine and its modules.
Use this tab to:
- Confirm NFO started cleanly after a restart
- Spot recurring warnings related to specific modules or exporters
- Identify the timestamp and context of an issue before pulling full log files
For deeper log analysis, access to raw log files, and generating a diagnostic bundle for support, see Logs & Diagnostics.