Installation
The DDoS Detector for Splunk App and Technology Add-on for NetFlow are designed to work together.
Download
- DDoS Detector for Splunk App https://splunkbase.splunk.com/app/4016/
- Technology Add-on for NetFlow https://splunkbase.splunk.com/app/1838/
Where to install
Install DDoS Detector Splunk App and Technology Add-on for NetFlow.
| Splunk Node | What to install |
|---|---|
| Search Head | Add-on and App |
| Indexer | Add-on only |
| Heavy Forwarder | Add-on only |
| Universal Forwarder | None |
Post Installation Steps
Create a data input
Use the GUI to create a Data Input, or create it in inputs.conf using the CLI. Make sure sourcetype is set to flowintegrator.
GUI
- In the top right corner, click Settings -> Data inputs
- In the row for UDP click Add new
- Enter a port number and click Next
- Click Select Sourcetype and type flowintegrator
- Change the App Context to the Technology Add-on for NetFlow (TA-netflow)
- Set any other settings such as Method or Index as appropriate for your environment
- Click Review, followed by Submit
CLI
Create the inputs.conf in the correct directory: $SPLUNK_HOME/etc/apps/TA-netflow/local/inputs.conf
Add the following lines to the inputs.conf file. This examples uses the syslog port UDP 10514. Change the port as needed:
[udp://10514]
sourcetype = flowintegrator
By default NetFlow Optimizer events will be stored in main index. In case you want to use another index, for example flowintegrator, please create the $SPLUNK_ROOT/etc/apps/TA-netflow/local/indexes.conf file, and add the following lines to it:
[flowintegrator]
homePath    = $SPLUNK_DB/flowintegrator/nfi_traffic/db
coldPath    = $SPLUNK_DB/flowintegrator/nfi_traffic/colddb
thawedPath  = $SPLUNK_DB/flowintegrator/thaweddb
In that case make sure your $SPLUNK_ROOT/etc/apps/TA-netflow/local/inputs.conf file contains the following:
[udp://10514]
sourcetype = flowintegrator
index = flowintegrator
Verify the configuration
To test that NFO syslogs reached Splunk, go to default Search App, and type:
index=flowintegrator sourcetype=flowintegrator
If Splunk is getting the syslogs from NFO, then you’ll see events show up here.
Setting up Local subnets
The App relies on the list of local subnets to determine inbound / outbound traffic and attackers and victims location. Default my-subnets.csv file is located here:
$SPLUNK_ROOT /etc/apps/ddos_detector/lookups and contains the following:
subnet,description
10.0.0.0/8,ClassA
172.16.0.0/12,ClassB
192.168.0.0/16,ClassC
Please copy this file to $SPLUNK_ROOT/etc/apps/ddos_detector/local/lookups and add your subnets.
Setting Email Alerting
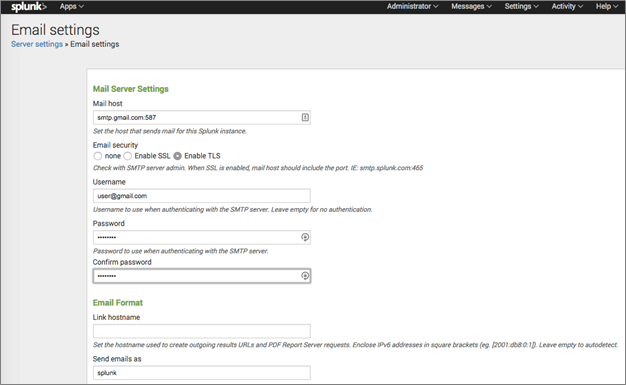
As the first step, if not already done, the outbound email server settings needs to be configured. It could be an internal email server or external mail service (Gmail for example).
Gmail configuration is shown below.
Mail host = smtp.gmail.com:587
Email security = TLS
Username = <YOUR_GMAIL_ADDRESS>
Password = <YOUR_GMAIL_PASSWORD>
After filling in the details in the “Mail Server Settings”, also the Link hostname should be configured in the “Email format” section. Use the following format: https://hostname:port_number (example: https://mysplunk.com:8000). Don’t leave it blank for autodetect -- it may not work. This value is later used in the email alert to create a clickable link.
The DDoS email notifications recipients list is empty by default. See Alerts section with details how to set up alerts parameters.
Please, note, that if you change anything on this configuration page, you must also erase and re-enter the "Password" and "Confirm password" fields. Otherwise the password will be reset and no email notifications will be sent.