DDoS Detector Module Configuration
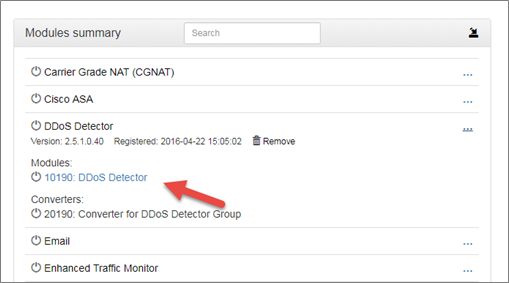
The Module is highly configurable. Click on DDoS Detector.
You will be presented with the following screen.
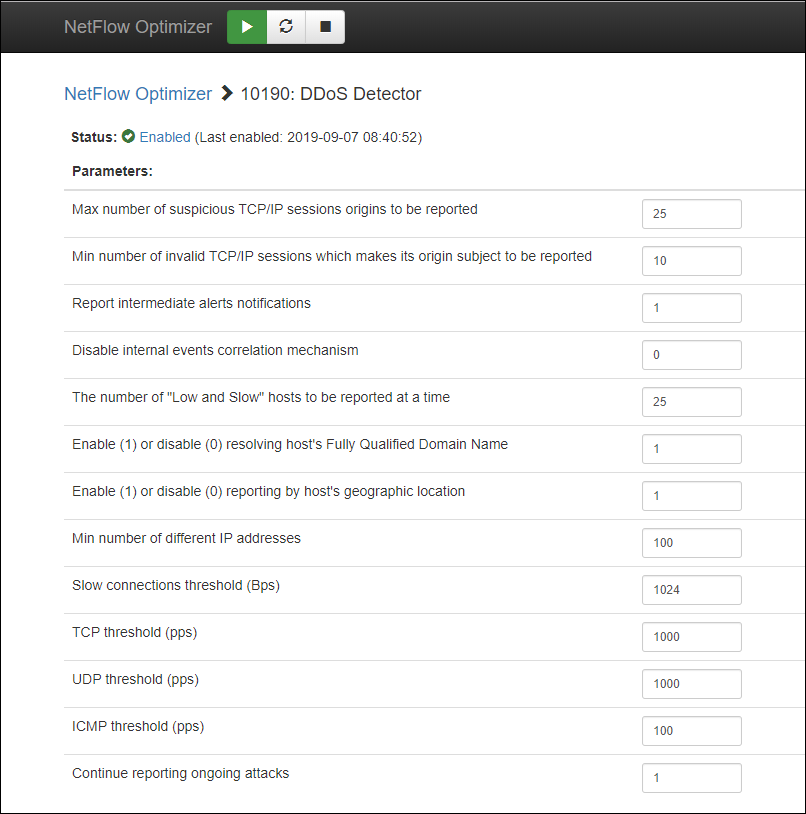
Change configuration parameters as desired and press the button. You don’t need to restart NetFlow Optimizer nor enable/disable the Module in order for the new parameters to take effect.
| Parameter | Description |
|---|---|
| Max number of suspicious TCP/IP sessions origins to be reported | Maximum number of TCP/IP sessions reported by the following experts: TCP/IP Information, Application Protocol Level Attack (min = 0, max = 10000, default: 25) |
| Min number of invalid TCP/IP sessions which makes its origin subject to be reported | Minimum number of invalid TCP/IP sessions that triggers reporting by TCP/IP Information expert and "Low and Slow" expert (min = 1, max = 100, default = 10) |
| Report intermediate alerts notifications | 1 – report intermediate alerts notifications, 0 – do not report intermediate alerts notifications (default = 1) |
| Disable internal events correlation mechanism | 1 – disable internal event correlator, 0 – enable internal event correlator (default = 0) |
| The number of "Low and Slow" hosts to be reported at a time | The number of "Low and Slow" hosts to be reported by Low and Slow Attack expert (min = 0, max = 10000, default = 25) |
| Enable(1) or disable (0) resolving host's Fully Qualified Domain Name | 1 – enable DNS host name resolution, 0 – disable DNS host name resolution (default = 0) |
| Enable(1) or disable (0) reporting by host's geographic location | 1 – enable GeoIP enrichment, 0 – disable GeoIP enrichment (default = 0) |
| Min number of different IP addresses | Minimum number of different IP addresses that triggers reporting by the New IP Addresses Arrival Rate and Elevated Noise Level experts (min = 1, max = 1000000, default = 100) |
| Slow connections threshold (Bps) | "Low and Slow" expert monitors only long TCP sessions, where ingress traffic rate is below this threshold and egress has no payload or vice versa. (default 1024, min 1, max 1000000) |
| TCP threshold (pps) | This parameter is used by "Network Traffic Properties" expert. When TCP packet rate is lower than this threshold value, the attack is not reported. (default 1000, min 1, max 1000000000) |
| UDP threshold (pps) | This parameter is used by "Network Traffic Properties" expert. When UDP packet rate is lower than this threshold value, the attack is not reported. (default 1000, min 1, max 1000000000) |
| ICMP threshold (pps) | This parameter is used by "Network Traffic Properties" expert. When ICMP packet rate is lower than this threshold value, the attack is not reported. (default 100, min 1, max 1000000000) |
| Continue reporting ongoing attacks | 1 – continue reporting ongoing attack periodically, 0 – report only the beginning of the attack or when the confidence level is increased (default = 1) |
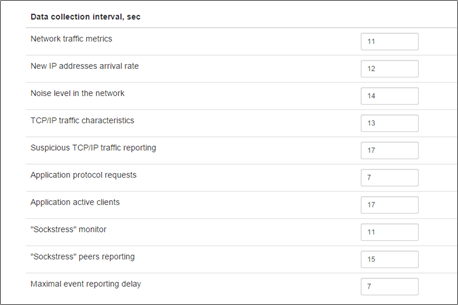
This section contains data collection intervals for various attack type.
note
Please contact NetFlow Logic support before changing Data collection intervals.
| Data Collection Interval | Description |
|---|---|
| Network traffic metrics | Time interval between two successive invocations of the network traffic analysis mechanism, in seconds |
| New IP addresses arrival rate | Time interval between two successive invocations of the IP addresses composition mechanism, in seconds |
| Noise level in the network | Time interval between two successive invocations of the noise level in the network tracker, in seconds |
| TCP/IP traffic characteristics | Time interval between two successive invocations of the TCP/IP traffic monitor, in seconds |
| Suspicious TCP/IP traffic reporting | Time interval between two successive invocations of the TCP/IP traffic monitor reporting function, in seconds |
| Application protocol requests | Time interval between two successive invocations of the Application Protocol Level Attack expert |
| Application active clients | Time interval between two successive invocations of the reporting of Application Protocol Level Attack sources |
| Low and Slow monitor | Time interval between two successive invocations of the "Low and Slow" Attack expert |
| Low and Slow peers reporting | Time interval between two successive invocations of the reporting of "Low and Slow" Attack sources |
| Maximum event reporting delay | Maximum time between event detection and reporting to external system, in seconds |
This section contains Module Configuration Data set.
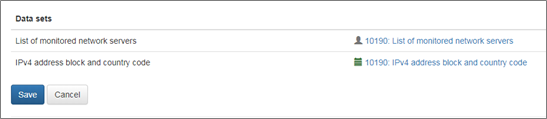
Specify the data set parameters.
| Data set | Description |
|---|---|
| List of monitored network servers | This is the list of applications you want to protect against application level attacks. It should be specified in the following format: [IPv4 Address],[Port],[IP Protocol],[Protocol name]. For example: 10.10.20.11,80,6,HTTP |
| IPv4 address block and country code | Mapping of country codes to IP addresses blocks. This list is updated by External Data Feeder for NFO, which uses the MaxMind GeoLite Country database as a source. |