Path Analytics Dashboard
This dashboard enables you to explore network conversations between communicating network peers. First select the time interval and press button. You will see a graph representing all network conversations during the selected time. Physical hosts are grouped in the inner circle, and VMs are grouped in the outer circle.
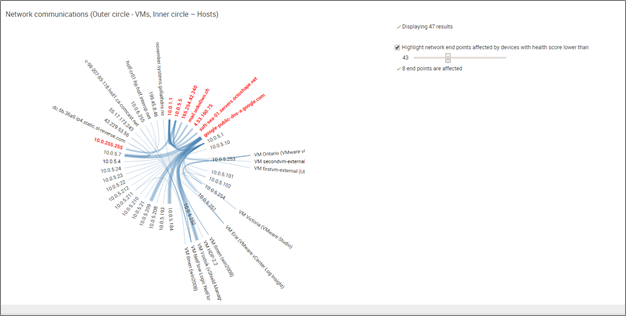
Narrow down the results by specifying full or partial IP address of communicating peers. Apply additional filters by specifying VTEP IP and/or VXLAN ID. Use the slider to highlight communicating endpoints affected by devices and interfaces with low health score.
Select the first object (A) by clicking on the IP address. Select the second object (B) from a drop down. The Path panel will dynamically populate with the path between the selected objects.
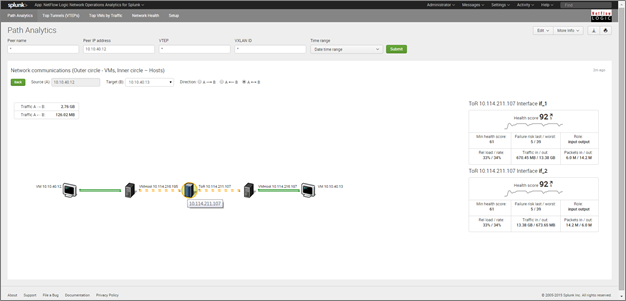
Explore paths by selecting direction: A->B, B->A, or bidirectional A<->B. This panel is a great way to see where the problem is. The color of network nodes indicates the health score of the interfaces in the path of communication between the selected objects.
The table on the right hand side provides the following information about the selected device:
- Device health score – a number between 0 and 100 with the lower scores indicating a device with one or more problematic interfaces
- Device failure risk score - a number between 0 and 100 with the higher scores indicating an interface with a high probability of failure
- Relative traffic load on a most active interface as a percent of its nominal capacity
- Relative packet rate on a most active interface as a percent of a maximum packet rate sustainable at a current average packet size
For interfaces relaying a traced communication the following information is presented:
- Interface health score
- Interface failure risk score
- Relative traffic load on this interface as a percent of its nominal capacity
- Relative packet rate on this interface as a percent of a maximum packet rate sustainable at a current average packet size
- A total number of bytes passed in each direction through this interface over a selected time interval
- A total number of packets passed in each direction through this interface over a selected time interval