Troubleshooting Guide
Introduction
This guide is designed to assist you in resolving common issues and challenges you might encounter while using NetFlow Optimizer.
NetFlow Optimizer software consists of the following components:
- NFO Server (nfc_svr process): This is the core component responsible for receiving and processing network flow data. It interacts with data sources, performs initial validation and parsing, processes flow data by enabled Modules, and sends consolidated and enriched data out to SIEM or other systems. The NFO Server logs its activities and potential issues in detail, providing valuable information for troubleshooting.
- NFO Controller (tomcat, jsvc processes): The NFO Controller acts as the web-based user interface and management layer for NFO. It allows you to configure settings, view reports, and manage various functionalities. The Controller logs its activities, including user actions, configuration changes, and any errors encountered.
- External Data Feeder for NFO (EDFN) (jsvc process): The EDFN engine plays a crucial role in enriching and transforming the raw flow data. It logs its processing steps, potential errors, and performance metrics, aiding in troubleshooting data flow and enrichment issues.
NFO Logs and EDFN Logs
These components generate detailed logs that provide valuable insights into the health and performance of NFO. Understanding these logs is essential for troubleshooting issues effectively. The following tables provide a brief overview of the types of information you can find in each log category:
Table 1: NFO Server Logs
| File | Description |
|---|---|
| catalina.out and catalina.n.log | tomcat log files |
| localhost_access_log.* | HTTPS requests |
| nf2sl.log | NFO controller main log file |
| nfc_server.*.log | NFO server log file |
| nfo_audit.log | messages from NFO server to controller |
| nfo-output.log | output logs which are implemented in controller, such as Kafka, Azure and etc |
| processs.log | memory, CPU, network and NFO server statistics |
| server.*.log | NFO server start/stop scrip output |
| templates.log | NFv9/IPFIX templates |
Table 2: EDFN Logs
| File | Description |
|---|---|
| account.log | User identity agent logs |
| aws.log | AWS input agent logs |
| azure.log | Azure input agent logs |
| daemon.out | jsvc service logs |
| gcp.log | Google Cloud input agent logs |
| jul.0.log | other java logs |
| oci.log | Oracle Cloud input logs |
| updater.log | main EDFN log file |
By analyzing these logs and understanding the functionalities of each NFO component, you can effectively diagnose and resolve issues related to data flow, processing, and overall NFO health.
Step 1: Checking Internal Connectivity
If you successfully installed NetFlow Optimizer (NFO), but unable to login at https://<nfo-host>:8443 where nfo‑host is the IP address or host name of the NFO machine, you may encounter internal connectivity issues.
Check Tomcat Ports (8443 and 20047)
sudo netstat -npl | grep jsvc
You should see something like this:
tcp6       0      0 :::8443                 :::*                    LISTEN      39504/jsvc.exec
tcp6       0      0 127.0.0.1:20047         :::*                    LISTEN      39504/jsvc.exec
Check Configuration Database Port (9001)
sudo netstat -nptl | grep :9001
You should see something like this:
tcp6 0 0 127.0.0.1:9001 :::* LISTEN 39557/../../java/jr
Check NFO Server Ports (when server is running)
sudo netstat -npl | grep nfc_svr
You should see something like this:
tcp        0      0 127.0.0.1:20048         0.0.0.0:*               LISTEN      40892/nfc_svr
udp6       0      0 :::9995                 :::*                                40892/nfc_svr
Check Connections between NFO Server and Tomcat (controller)
sudo netstat -npat | grep -E ":2004(7|8)"
You should see something like this:
tcp        0      0 127.0.0.1:20048         0.0.0.0:*               LISTEN      40892/nfc_svr
tcp        0      0 127.0.0.1:20048         127.0.0.1:46842         TIME_WAIT   -
tcp        0      0 127.0.0.1:43270         127.0.0.1:20047         TIME_WAIT   -
tcp6       0      0 127.0.0.1:20047         :::*                    LISTEN      39504/jsvc.exec
Step 2: Checking Firewall Rules
If you encounter any of the connectivity issues, you may check ufw or firewalld rules.
Ubuntu/Debian (ufw)
ufw status verbose
You should see something like this:
Status: active
Logging: on (low)
Default: deny (incoming), allow (outgoing), deny (routed)
New profiles: skip

To                         Action      From
--                         ------      ----
8443/tcp                   ALLOW IN    Anywhere
9995/udp                   ALLOW IN    Anywhere
162/udp                    ALLOW IN    Anywhere
8443/tcp (v6)              ALLOW IN    Anywhere (v6)
9995/udp (v6)              ALLOW IN    Anywhere (v6)
162/udp (v6)               ALLOW IN    Anywhere (v6)
Red Hat, Rocky Linux, CentOS (firewalld)
firewall-cmd --list-all
You should see something like this:
public (active)
  target: default
  icmp-block-inversion: no
  interfaces: eth0
  sources:
  services: dhcpv6-client ssh
  ports: 8443/tcp 9995/udp 162/udp
  protocols:
  masquerade: no
  forward-ports:
  source-ports:
  icmp-blocks:
  rich rules:
Step 3: Checking Rejected Connections
Ubuntu/Debian (ufw)
- Enable ufw logging:
sudo ufw logging low
- Check BLOCK messages using dmesg or journalctl:
journalctl -xe
dmesg | grep UFW | grep BLOCK
Red Hat, CentOS (firewalld)
- Get current firewalld log level:
sudo firewall-cmd --get-log-denied
- Change log level to all:
sudo firewall-cmd --set-log-denied=all
- Check REJECT messages using dmesg or journalctl:
journalctl -xe
dmesg | grep REJECT
- Revert firewalld log level if needed
Step 4: Checking NFO Connectivity with Exporters and Destinations
If you are able to login, but don't see incoming / outgoing traffic (you should see various counters increasing on the Status page), you may encounter connectivity issues beween NetFlow producers and NFO, or between NFO and destination systems.
Listening Ports (Inputs)
To check if NFO is listening on UDP port, and the port is not used by any other process, perform the following:
sudo netstat -lupn | grep ":9995"
You should see something like this:
3477468/nfc_svr
Incoming Traffic
To see incoming UDP traffic, you may use tcpdump utility. Here are a few examples:
sudo tcpdump -i any udp port 9995
sudo tcpdump -nni any port 2055 or port 9995 or port 4739 or port 6343 or port 9997
To see the HEX content of UDP packets:
sudo tcpdump -i any -XX udp port 9995
To capture incoming traffic in PCAP file use the following command:
sudo tcpdump -i any -p -s 0 -w netflow.pcap dst port 9995
With file rotation parameters:
sudo tcpdump -i any -p -s 0 -w netflow.pcap. -W 5 -C 10 -Z root dst port 9995
Outgoing Traffic
To see outgoing UDP messages, use the following command:
sudo tcpdump -nnAs0 dst 10.1.7.57 and udp port 1514
Step 5: NFO Logs
To help you identify NetFlow Optimizer (NFO) issues, you can share NFO logs with NetFlow Logic Support.
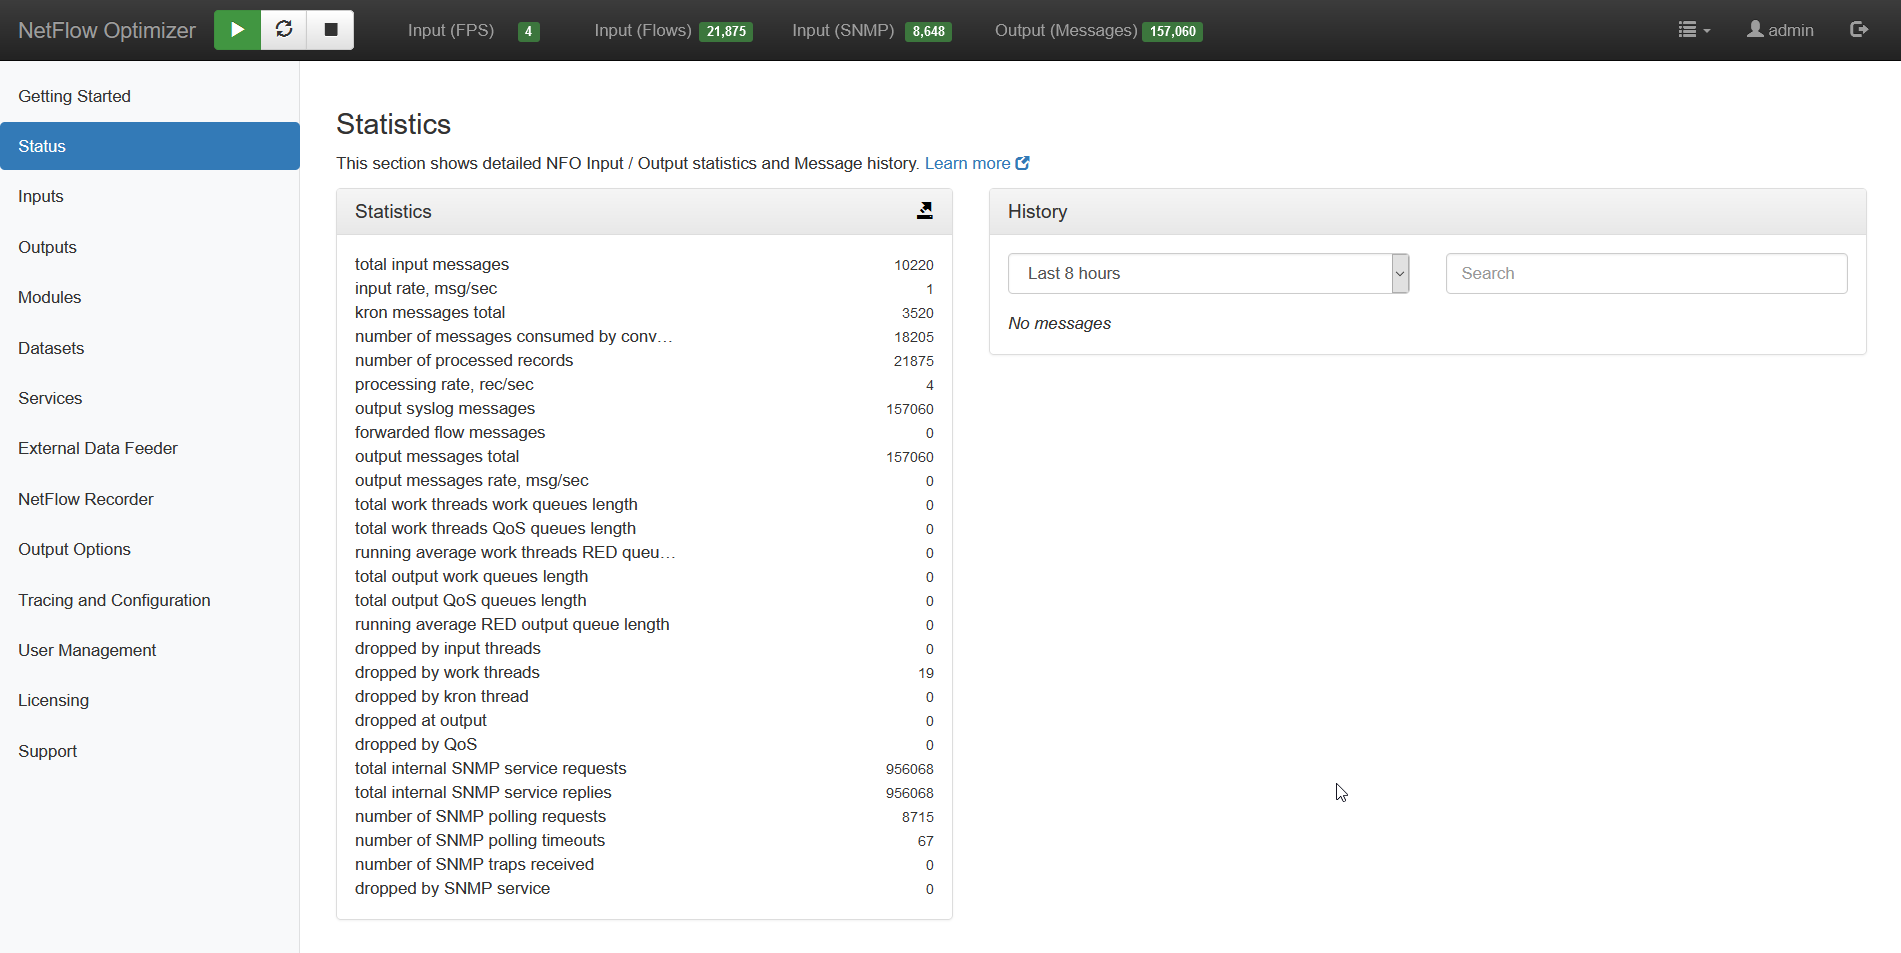
NFO logs its activity in $NFO_HOME/logs (NFO_HOME default is /opt/flowintegrator). You can also see their health on the Status page. This page shows input / output statistics, length of various queues, and drop counts.
The NFO internal log files are rolled based on size. Ten last files are kept in $NFO_HOME/logs/bak directory. You can change the default log rotation size and the number of “bak” files to keep by editing $NFO_HOME/server/etc/server.cfg.
Step 6: External Data Feeder for NFO Logs
EDFN performs the following functions:
- It feeds data to NFO for enrichments
- It receives cloud flow logs (AWS, Azure, Google)
EDFN logs its activity in $EDFN_HOME/logs (EDFN_HOME default is /opt/nfi-updater).
You can download logs from NFO by going to Tracing and Configuration on the left navigation bar, and clicking on Download logs button.
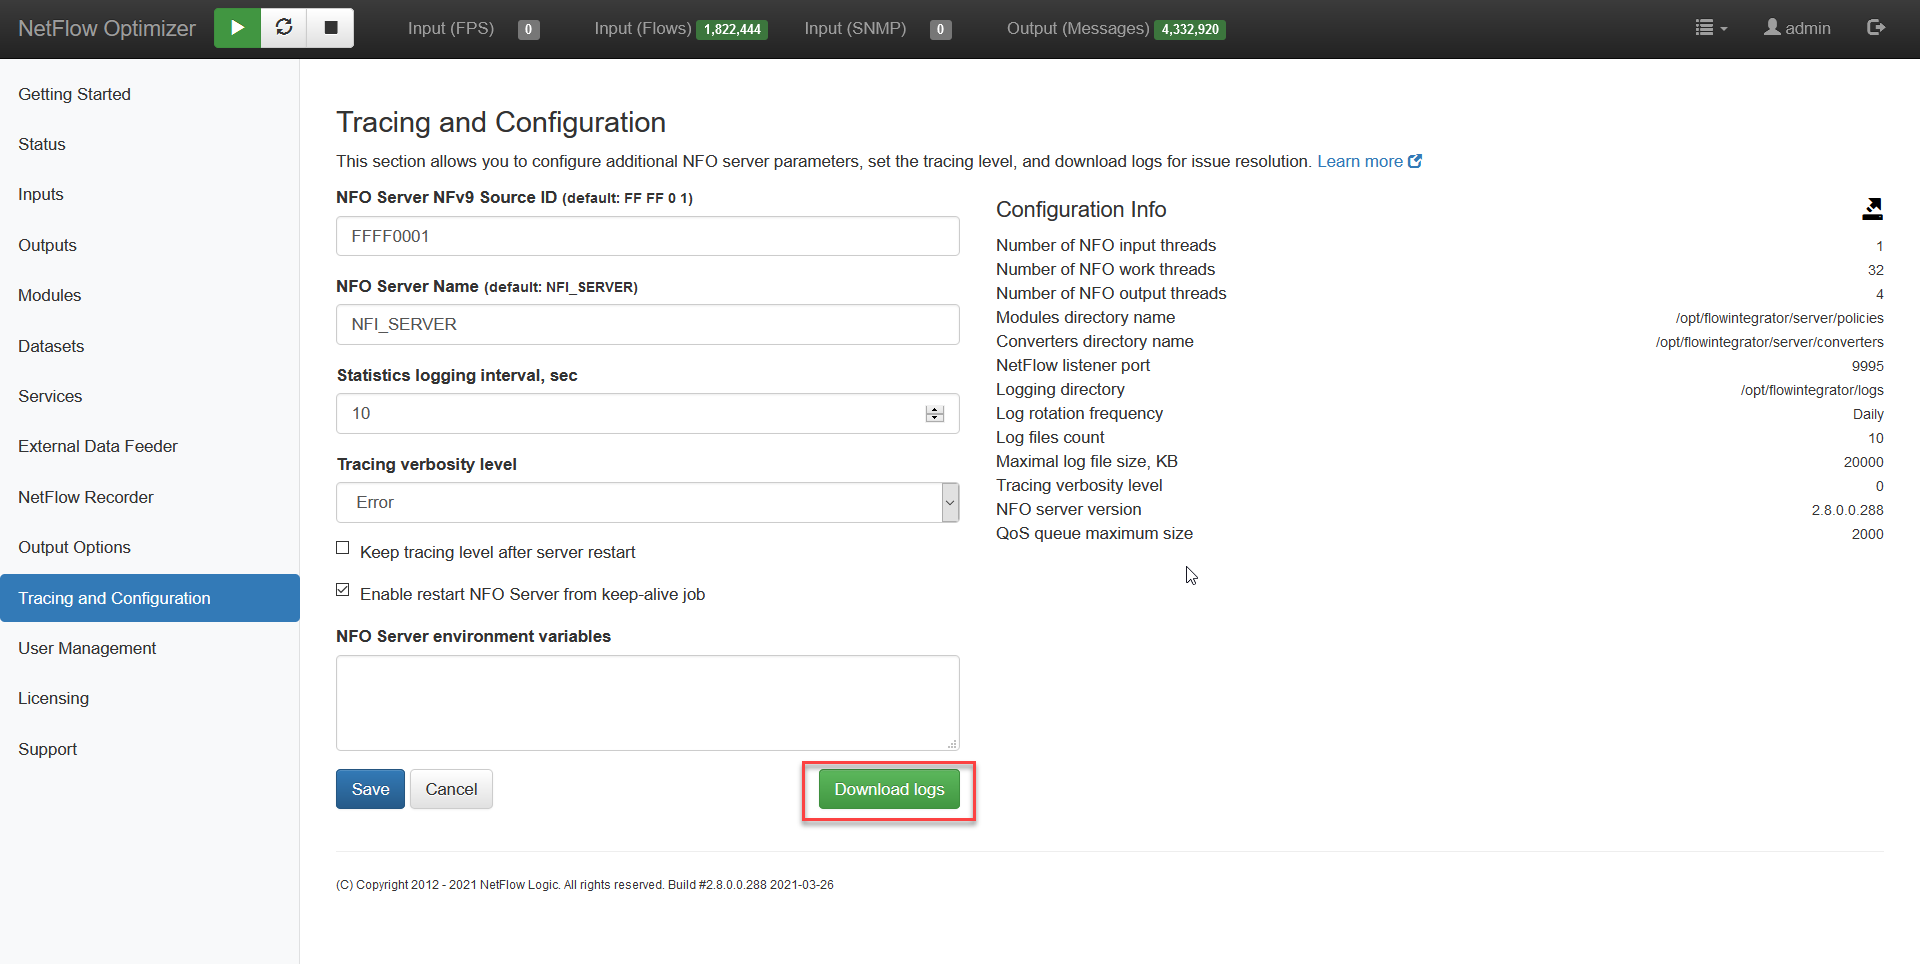
The zip file contains both NFO and EDFN logs.
You can securely share the logs with NetFlow Logic Support by opening a support ticket at https://www.netflowlogic.com/support.