Virtual to Physical Analytics
This dashboard relies on syslog messages generated by the following NFO Modules packaged in VMware Module Set:
- 10164: Top Host:VM Pairs Monitor
- 10167: Top VM:Host Traffic Monitor
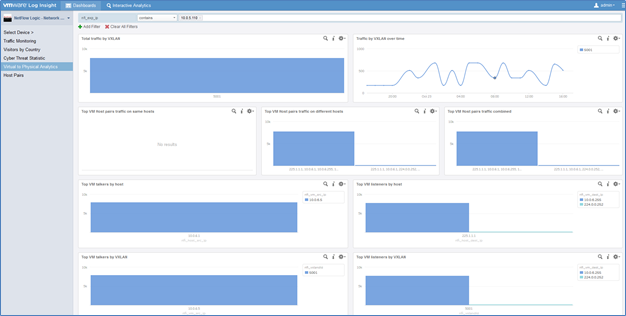
This dashboard has the following widgets.
Total traffic by VXLAN

This chart shows total traffic in bytes by each observed VXLAN ID.
Traffic by VXLAN over time
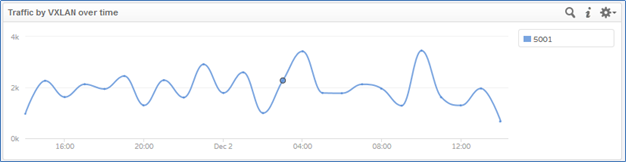
This chart shows traffic over time in bytes by each observed VXLAN ID over time.
Top VM Host pairs traffic on same hosts
This chart shows total traffic in bytes of the top VM pairs residing on the same hosts.
VM pair is defined as:
Client VM = nfi_vm_src_ip
Client host = nfi_host_src_ip
Server VM = nfi_vm_dest_ip
Server host = nfi_host_dest_ip
Top VM Host pairs traffic on different hosts
This chart shows total traffic in bytes of the top VM pairs residing on different hosts.

VM pair is defined as:
Client VM = nfi_vm_src_ip
Client host = nfi_host_src_ip
Server VM = nfi_vm_dest_ip
Server host = nfi_host_dest_ip
Top VM Host pairs traffic combined

Top VM talkers by host
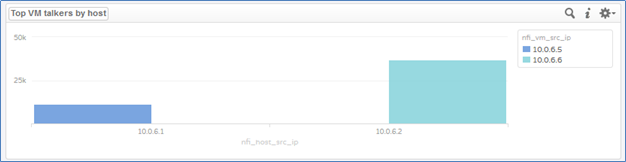
This chart shows top VM talkers by host.
VM is identified by nfi_vm_src_ip
Host is identified by nfi_host_src_ip
Top VM listeners by host
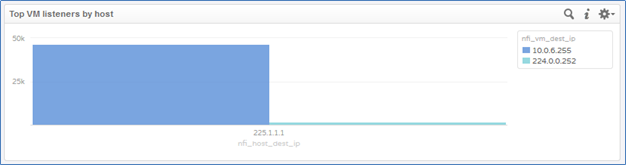
This chart shows top VM listeners by host.
VM is identified by nfi_vm_dest_ip
Host is identified by nfi_host_dest_ip
Top VM talkers by VXLAN
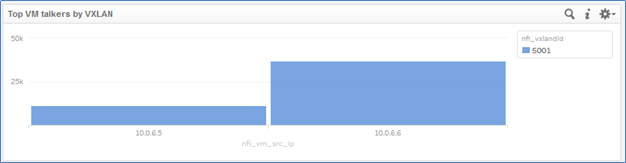
This chart shows top VM talkers by VXLAN.
VM is identified by nfi_vm_src_ip
Top VM listeners by VXLAN
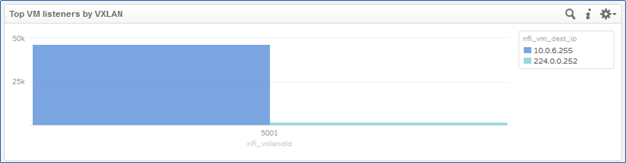
This chart shows top VM listeners by VXLAN.
VM is identified by nfi_vm_dest_ip