Unified Dashboard Guide
The NetFlow and SNMP Analytics for Splunk App provides instant visibility through a number of pre-built dashboards designed to transition from high-level infrastructure health to granular flow forensics in seconds.
Dashboard Categories & Required Modules
To optimize performance and visibility, dashboards are organized by functional goals. The data populated in these views depends on which NFO Module you have enabled.
1. Traffic Analysis & Forensics (Core Visibility)
These dashboards focus on volume, flow, and protocol distribution across the entire network.
Network Conversations (Deep Forensics)
- Primary View: Network Conversations.
- Required Module: Module 10062: Network Conversations.
- Capabilities: Provides bidirectional (stitched) flow data, allowing you to see the full "conversation" between two points. This dashboard replaces legacy, vendor-specific views for AWS, Azure, GCP, and Cisco ASA.
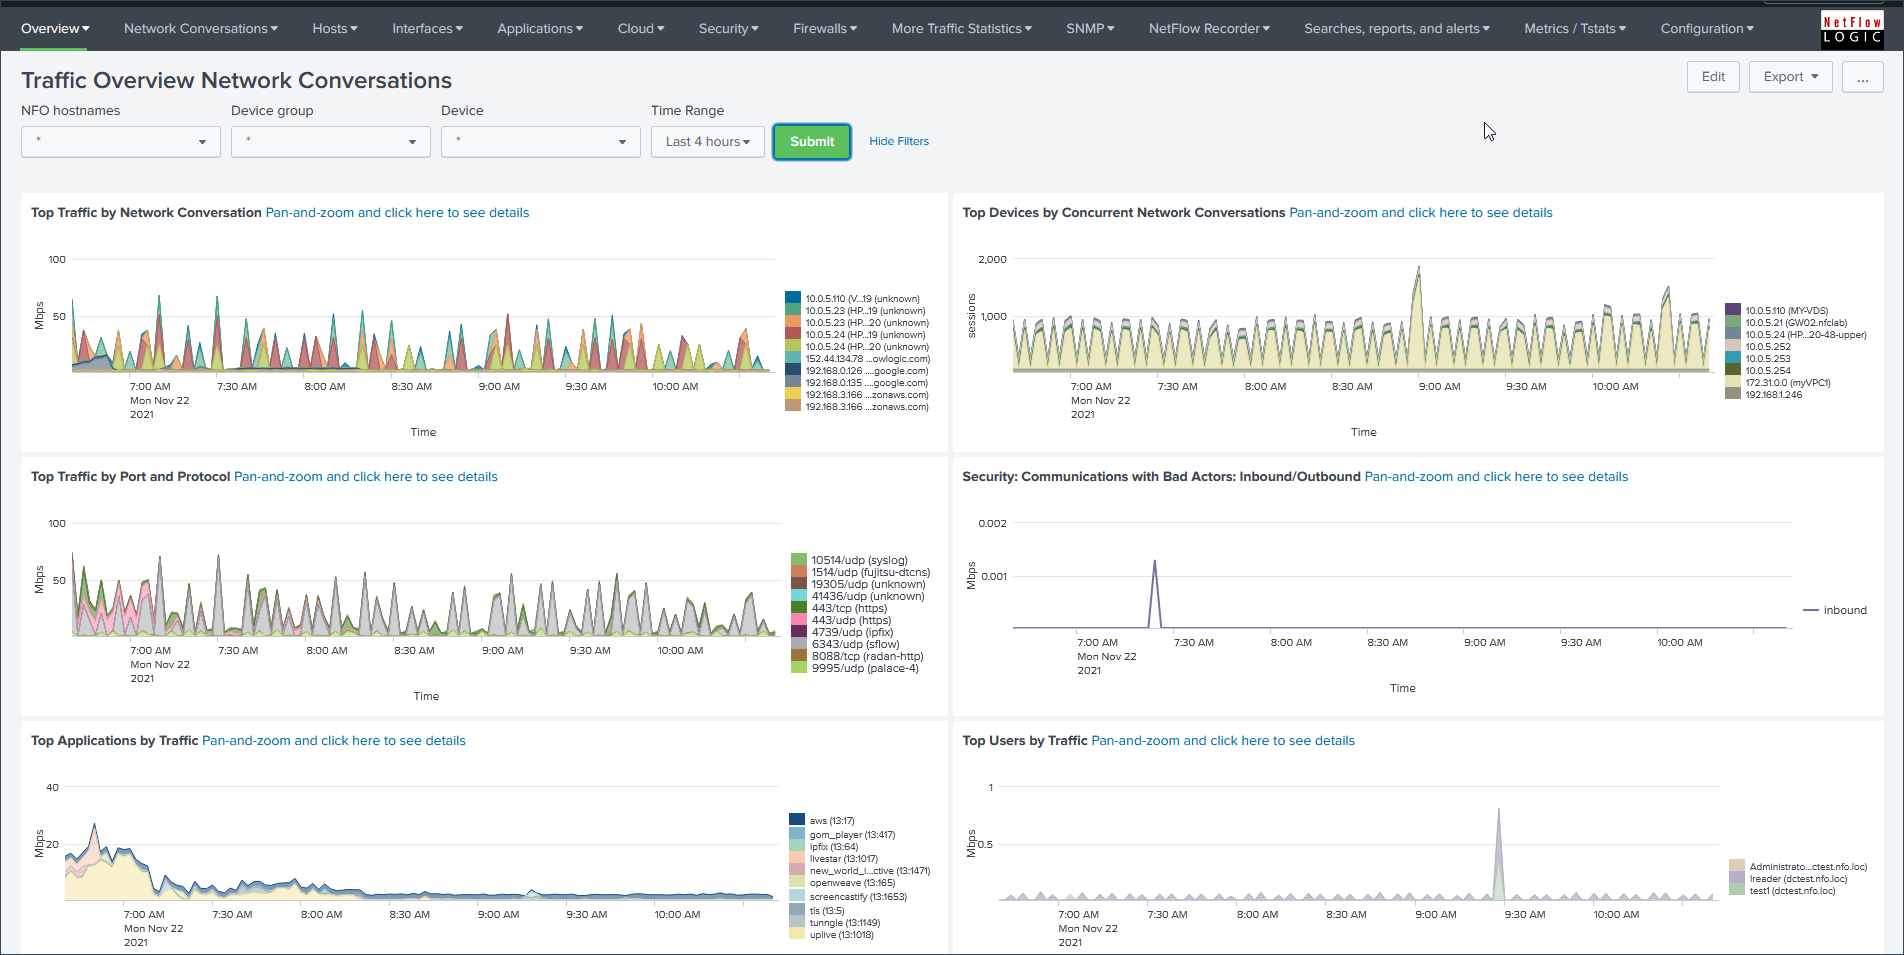
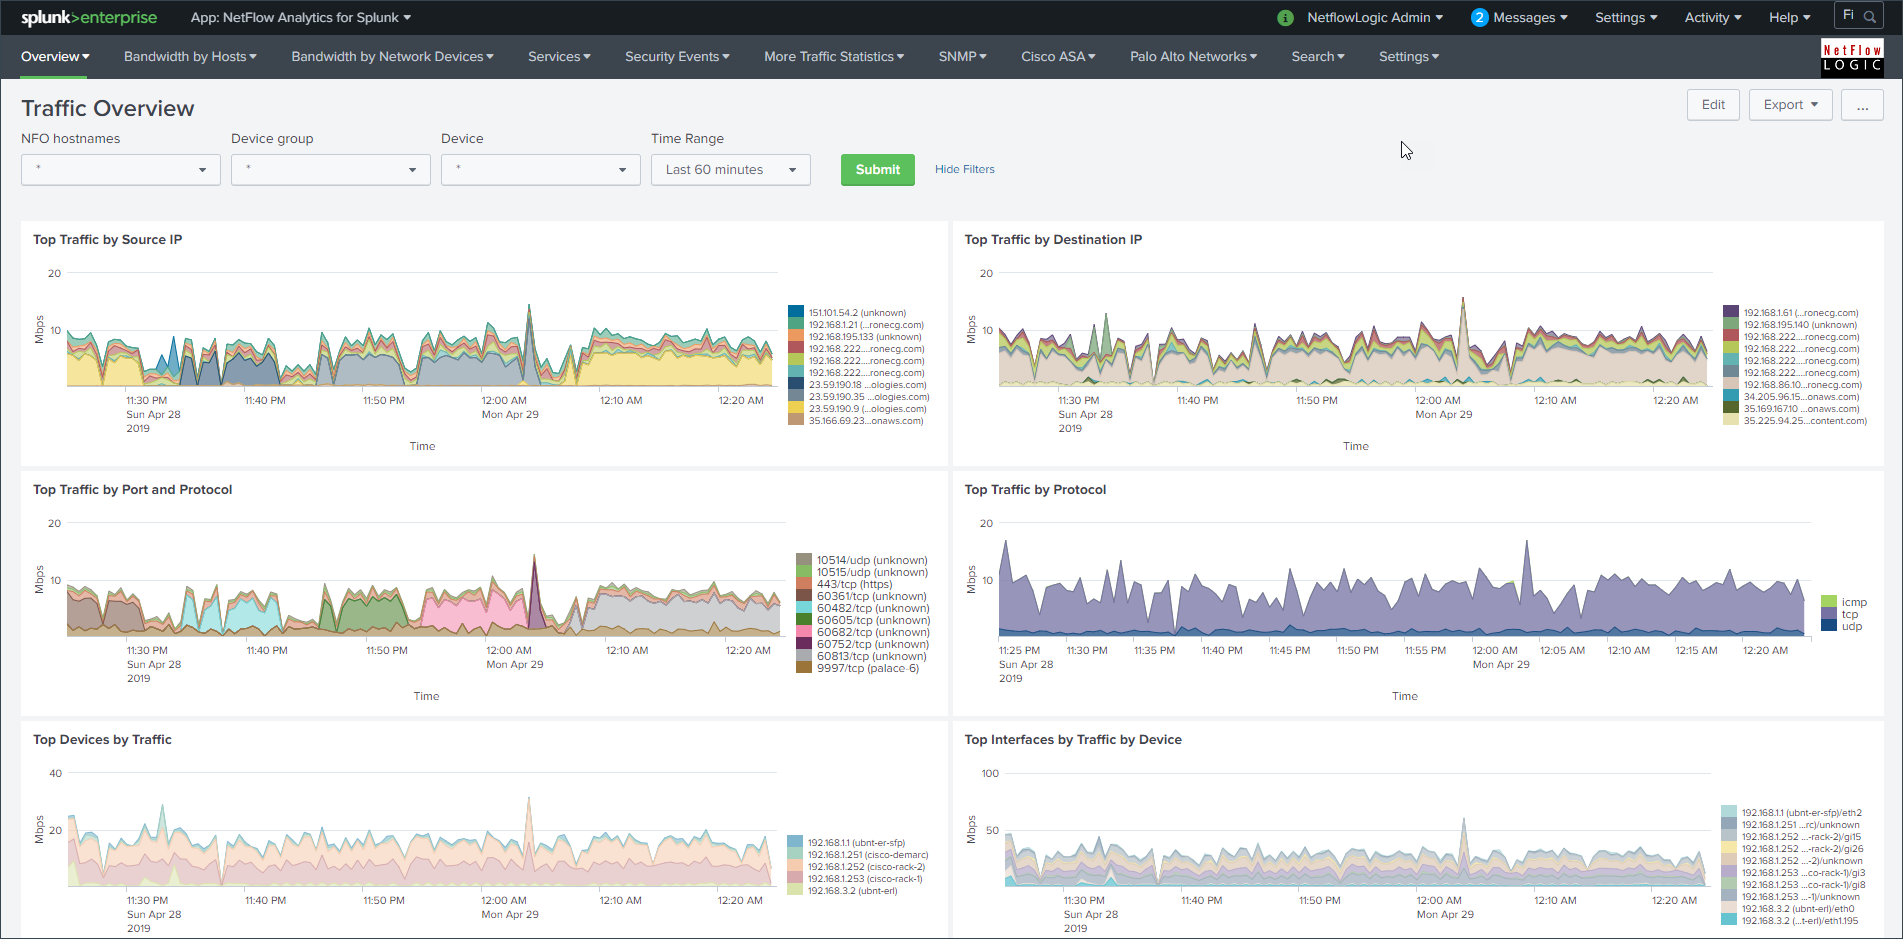
Traffic Overview / Top N (High Volume)
- Primary View: Traffic Overview / Top N.
- Required Module: Module 10067: Top Traffic Monitor.
- Capabilities: Optimized for high-volume environments (100Gbps+) where unidirectional "Top N" reporting is sufficient. This module consumes significantly fewer resources than Module 10062 while still providing critical bandwidth visibility.
2. Security & Threat Monitoring
Leverages NFO’s enrichment (Geo-IP, ASN, and Threat Intel) to highlight potential risks.
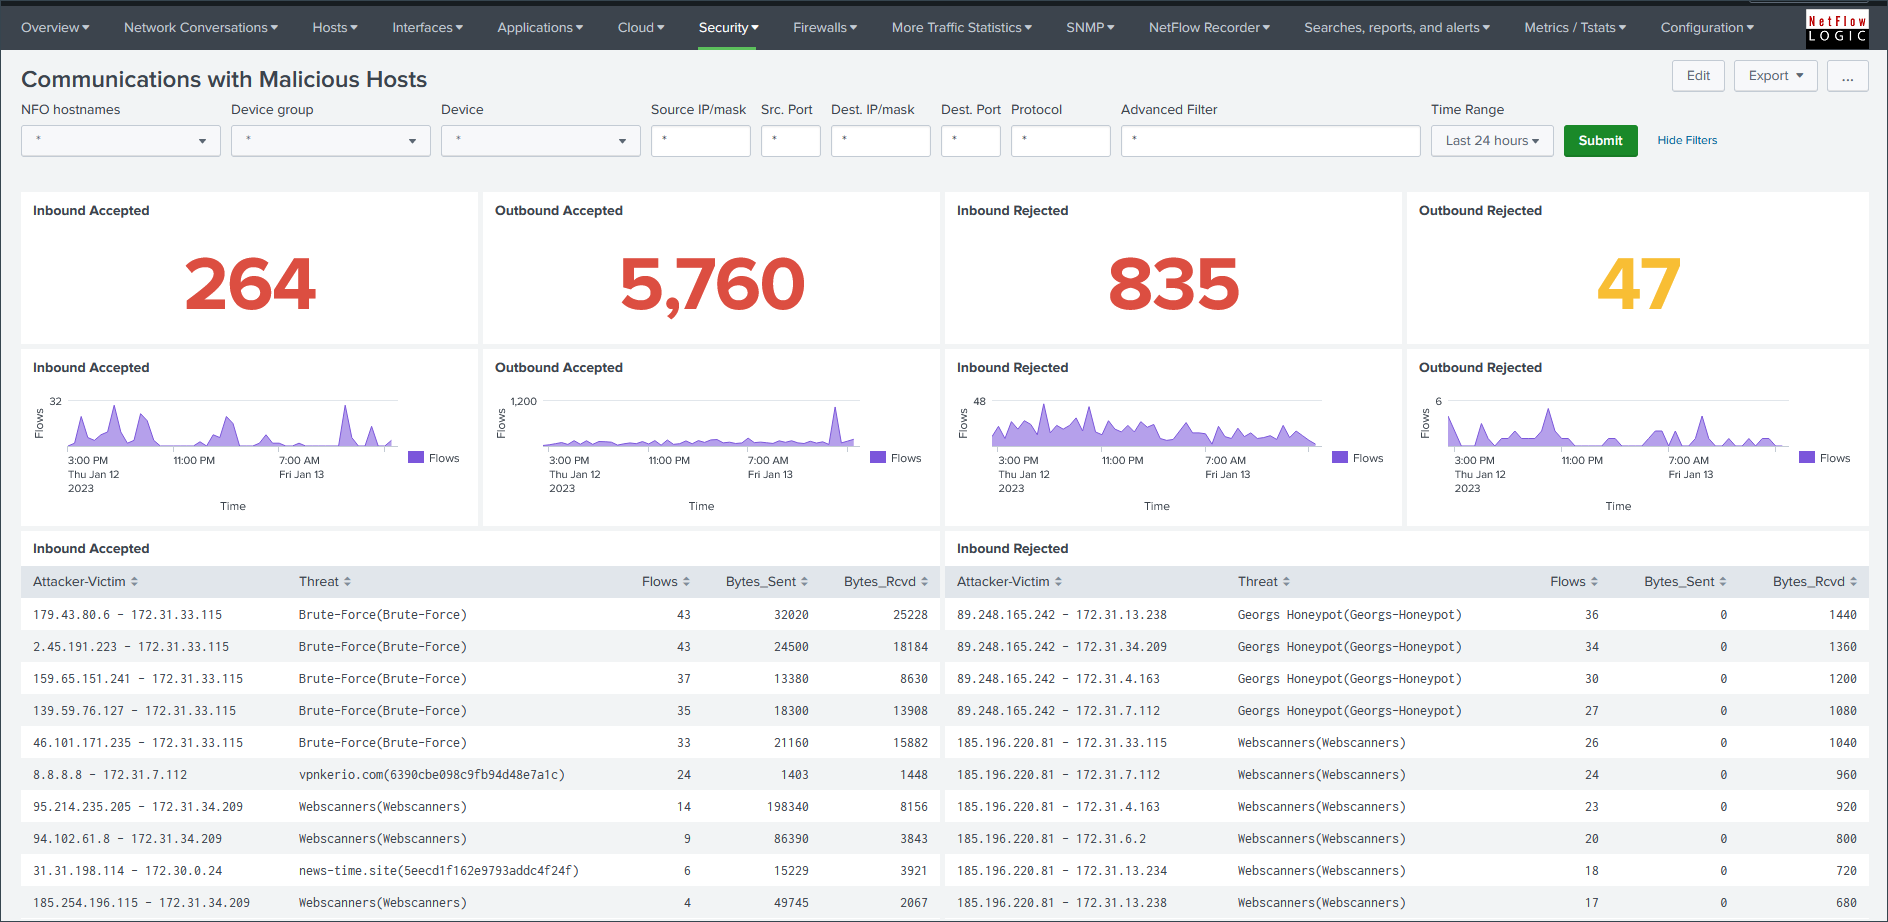
- Primary View: Communications with Malicious Hosts
- Best For: SOC analysts tracking lateral movement or unauthorized external connections.
- Requirement: Requires Module 10062: Network Conversations with Threat Intel configuration.
3. Network Operations & Health (NetOps)
Technical views focused on the performance of the network protocol stack and device hardware.
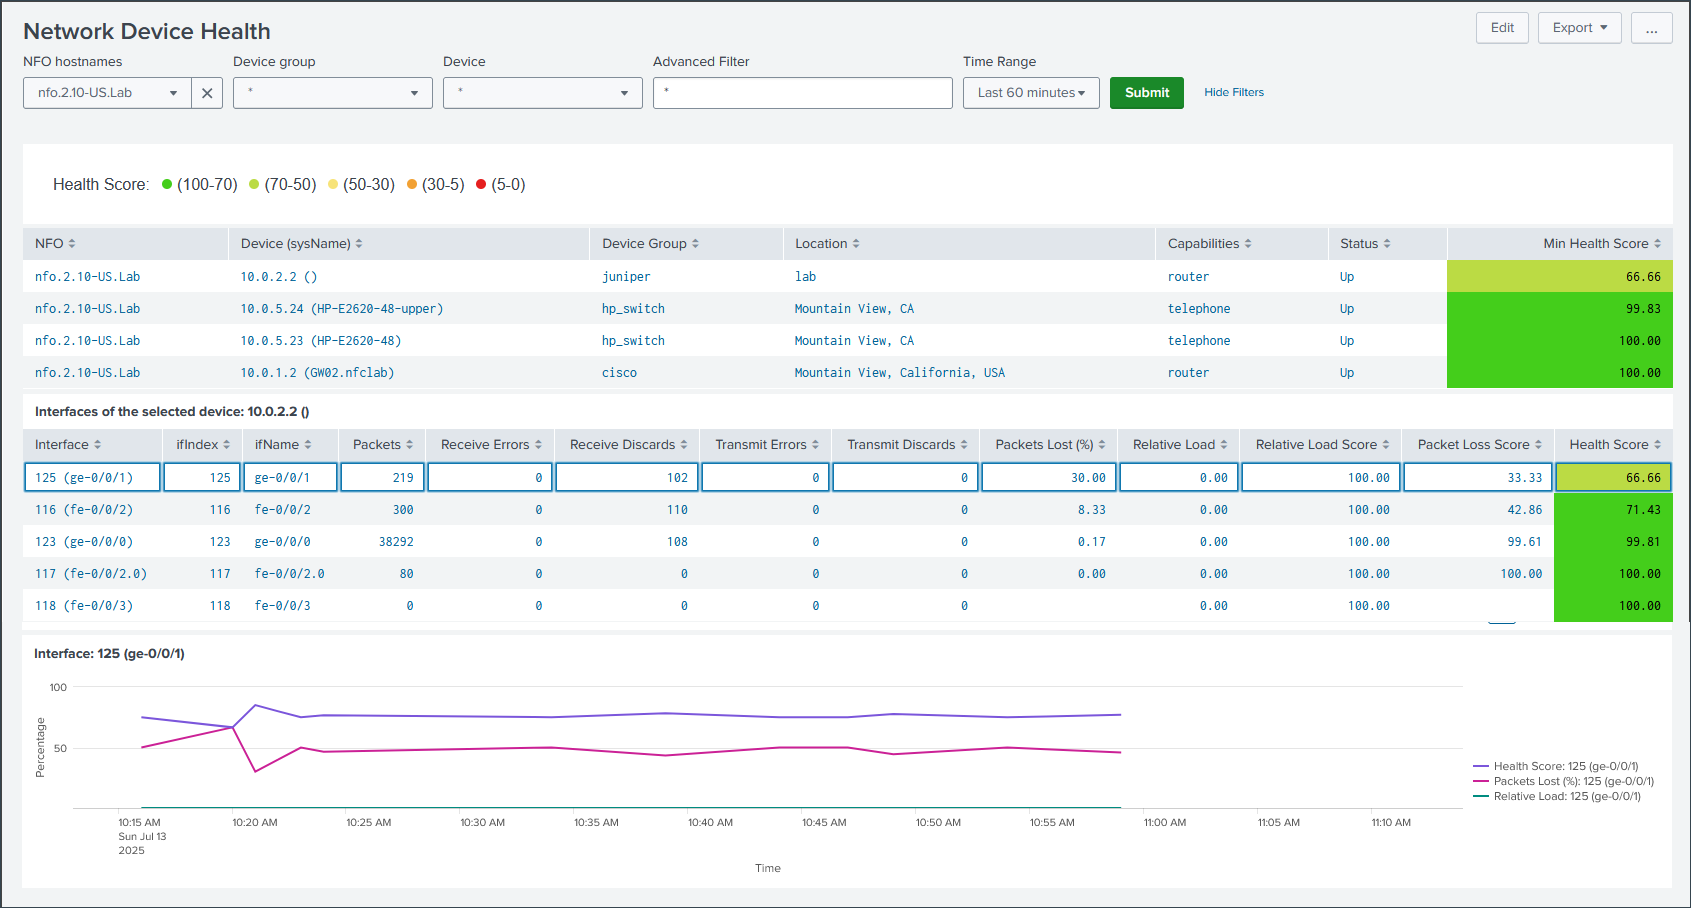
- Primary View: Network Device Health
- Required Modules: Auto-discovery Reporter and SNMP Custom OID Sets Monitor.
Using the Dashboards Effectively
- The Global Filter Bar: Use the standardized filter bar at the top to isolate data by NFO hostname, Device group, Device, or Time Range without writing SPL.
- Drill-down Capability: Most charts allow you to click on a data point to pivot to a Flow Forensics view pre-populated with those parameters.
- Migration Tip: If you are currently using dashboards labeled "Legacy" or "Deprecated," we strongly recommend migrating to the Network Conversations dashboard for superior performance and bidirectional data stitching.