SNMP
SNMP Polling
This dashboard is a search for NFO output from SNMP Custom OID Sets Monitor. For more information on this Module, visit SNMP Custom OID Sets Monitor.
SNMP Traps
This dashboard is a search for NFO output of SNMP Traps.
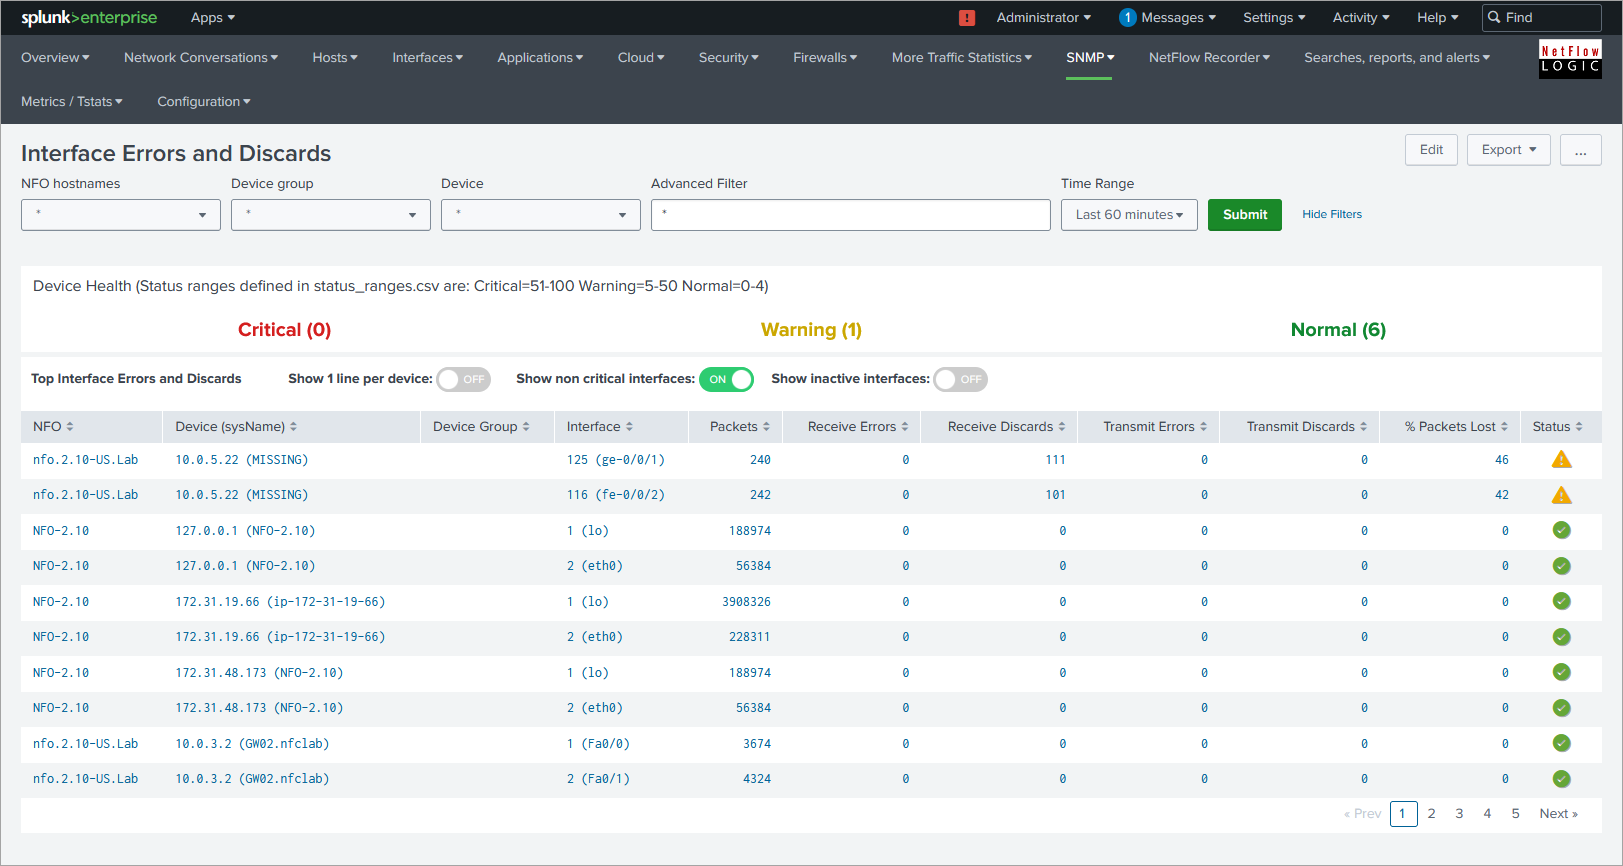
Interface Errors and Discards
This dashboard provides network device health statistics based on interface errors and discards counts, as depicted below:

It relies on events sent to Splunk by NFO SNMP Custom OID Sets Monitor Module fields defined in interface_mon OID set. This dashboard utilizes the following lookup files:
- snmp-devices.csv
- critical_interfaces.csv
The snmp-devices.csv file is populated by a saved search that runs every 30 minutes. You can trigger this search on the setup page by clicking the "update dropdowns" button.
To utilize the "Show non-critical interfaces" toggle, ensure the critical_interfaces.csv lookup file is set up correctly. Below is a sample of the critical_interfaces.csv lookup file:
nfo_hostname,"management_ip","snmp_index","comment"
localhost","10.0.3.2",1,"Important interface"
localhost",10.0.5.22,116,"Uplink"
SNMP Devices CPU and Memory
This dashboard provides network device health based on CPU and memory utilization, as depicted below:

It relies on events sent to Splunk by NFO SNMP Custom OID Sets Monitor Module. The following fields should be defined in this Module OID sets:
-
For CPU utilization:
cpu_load_percent -
For memory utilization: either
mem_used_percentor any two of the following OIDs:mem_used,mem_free, ormem_total
For more information, see SNMP Custom OID Sets Monitor section in Getting Started Guide: SNMP Polling.