SNMP
SNMP Polling
This dashboard is a search for NFO output from SNMP Custom OID Sets Monitor. For more information on this Module, visit SNMP Custom OID Sets Monitor.
SNMP Traps
This dashboard is a search for NFO output of SNMP Traps.
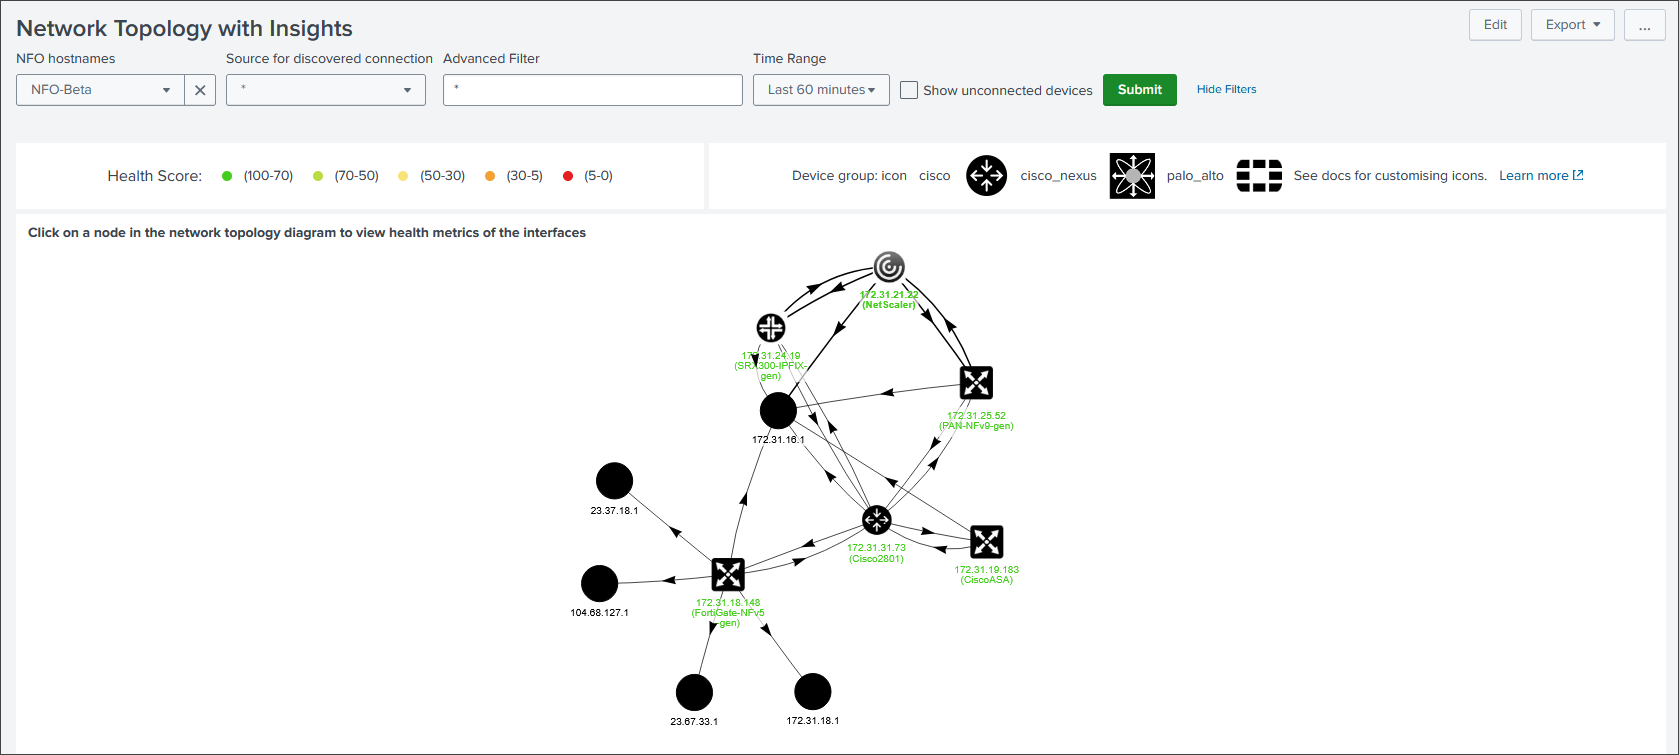
Network Topology with Insights
This dashboard visualizes your network topology based on devices and their connections automatically discovered through SNMP.
Data Source
This dashboard relies on events sent to Splunk by the NFO Auto-discovery Reporter.
Drill-down panels rely on SNMP Custom OID Sets Monitor.
Requirements
- App: Network Diagram Viz - This app is required on searchheads for topology visualization.
- Lookup File:
topology_icons.csv- This lookup file assigns icons to device groups.
Interactive Features
- Drill-down: Clicking on a device node in the topology diagram opens a detailed drill-down panel below.
- Interface Details: The drill-down panel displays information about the selected device's interfaces, including:
- Interface Name
- Vital Statistics: Errors, discards, and relative load
- Health Score: A calculated health score for each interface, indicating its overall performance and status.
- Over-Time Charts: A further drill-down on a specific interface provides timecharts for its health score, packet loss, and relative load, allowing you to analyze historical performance and identify trends.
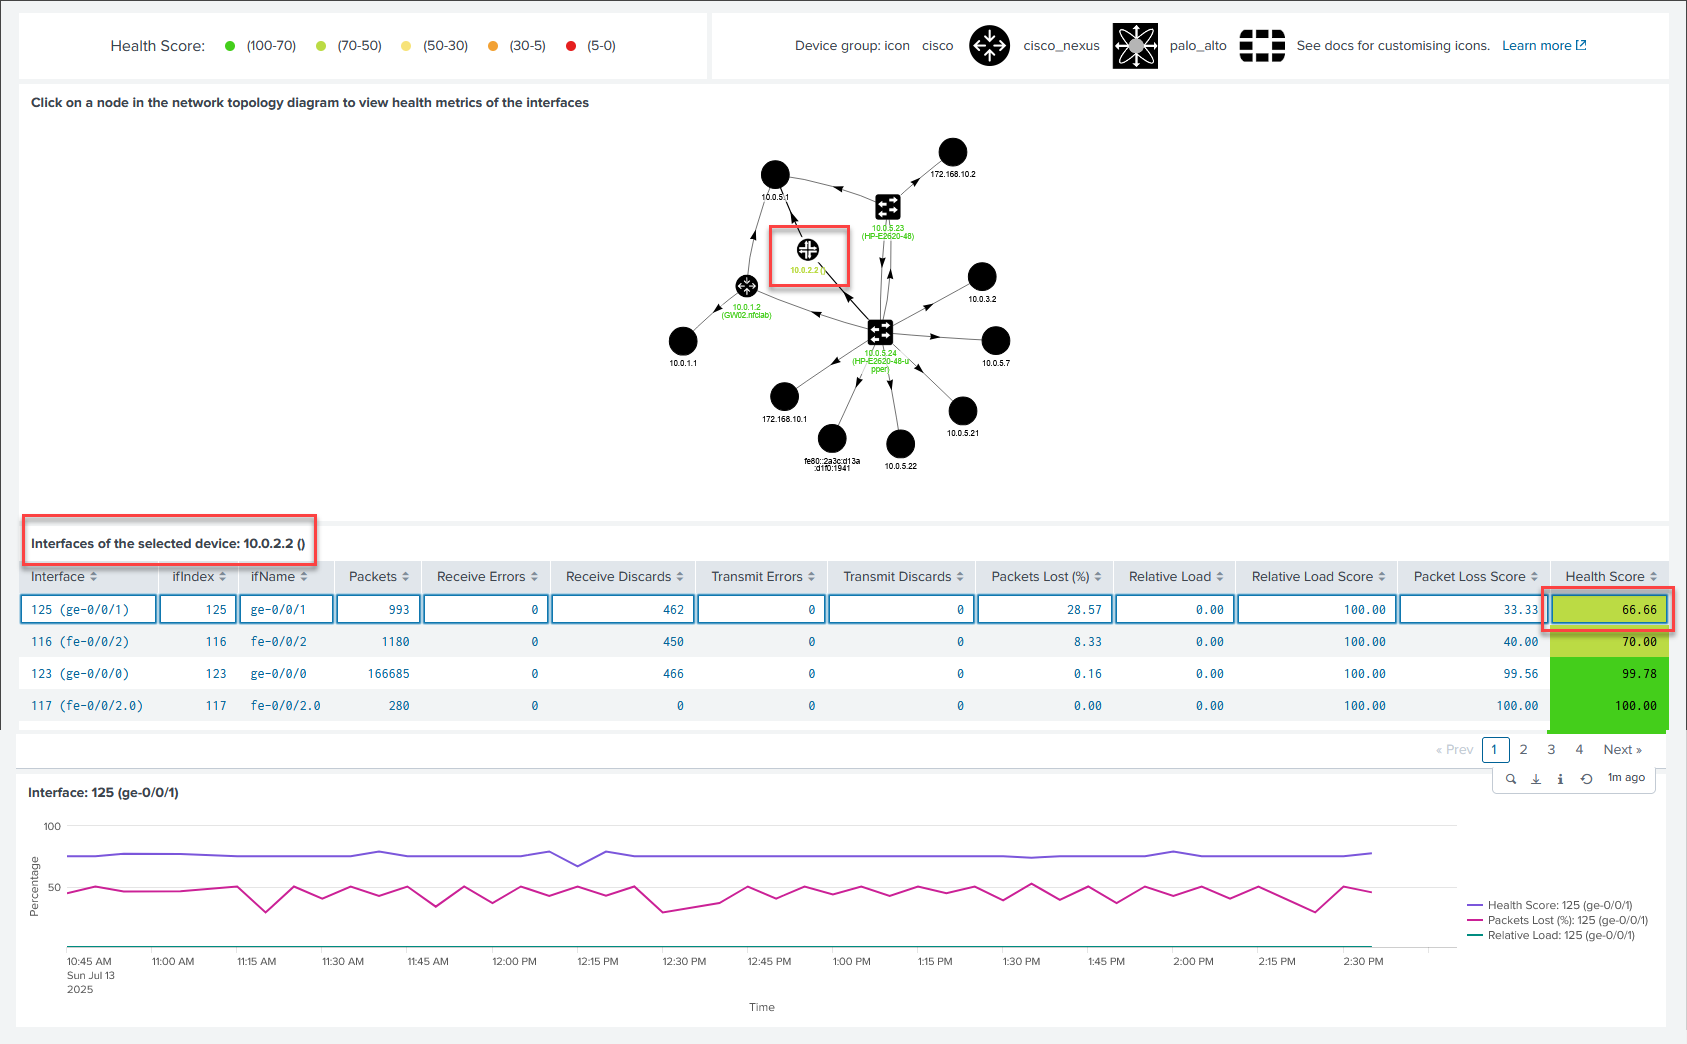
This interactive functionality allows you to quickly assess the health and performance of individual devices and their interfaces within your network topology.
Adding Custom Icons (Optional)
For best results, custom icons should have a transparent background with a size of 46x46 pixels and a resolution of 96x96 pixels/inch. Supported formats include JPG, PNG, SVG, and GIF.
-
Copy your custom icons to the following folder on the searchheads:
%SPLUNK_HOME%/etc/apps/netflow/appserver/static/customimages/ -
This will place your icons in the following path:
/static/app/network-diagram-viz/customimages/ -
The icons will be referenced from the topology_icons.csv lookup file.
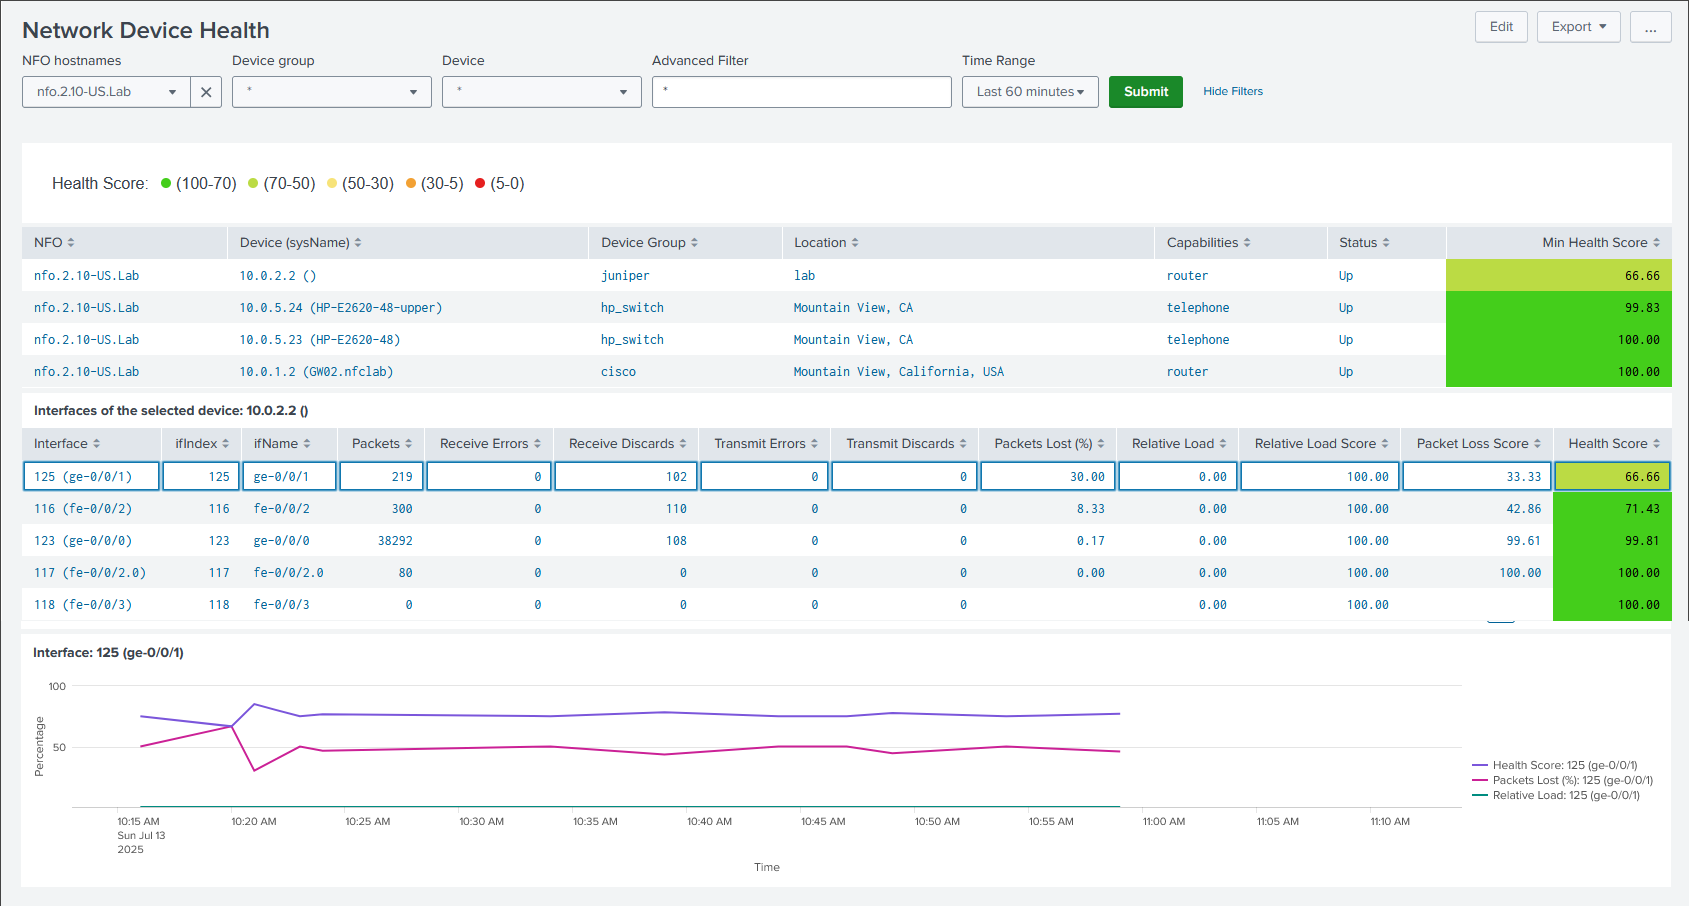
Network Device Health
The Network Device Health dashboard provides a comprehensive overview of your network device and interface performance, allowing you to quickly identify and troubleshoot potential issues. This dashboard leverages SNMP-polled data to present key health metrics and interactive drill-down capabilities.
Data Source
This dashboard relies on events sent to Splunk by the NFO Auto-discovery Reporter.
Drill-down panels rely on SNMP Custom OID Sets Monitor.
Interactive Features
- Drill-down: Clicking on a device row in the table opens a detailed drill-down panel below.
- Interface Details: The drill-down panel displays information about the selected device's interfaces, including:
- Interface Name
- Vital Statistics: Errors, discards, and relative load
- Health Score: A calculated health score for each interface, indicating its overall performance and status.
- Over-Time Charts: A further drill-down on a specific interface provides timecharts for its health score, packet loss, and relative load, allowing you to analyze historical performance and identify trends.
Interface Errors and Discards
This dashboard provides network device health statistics based on interface errors and discards counts, as depicted below:
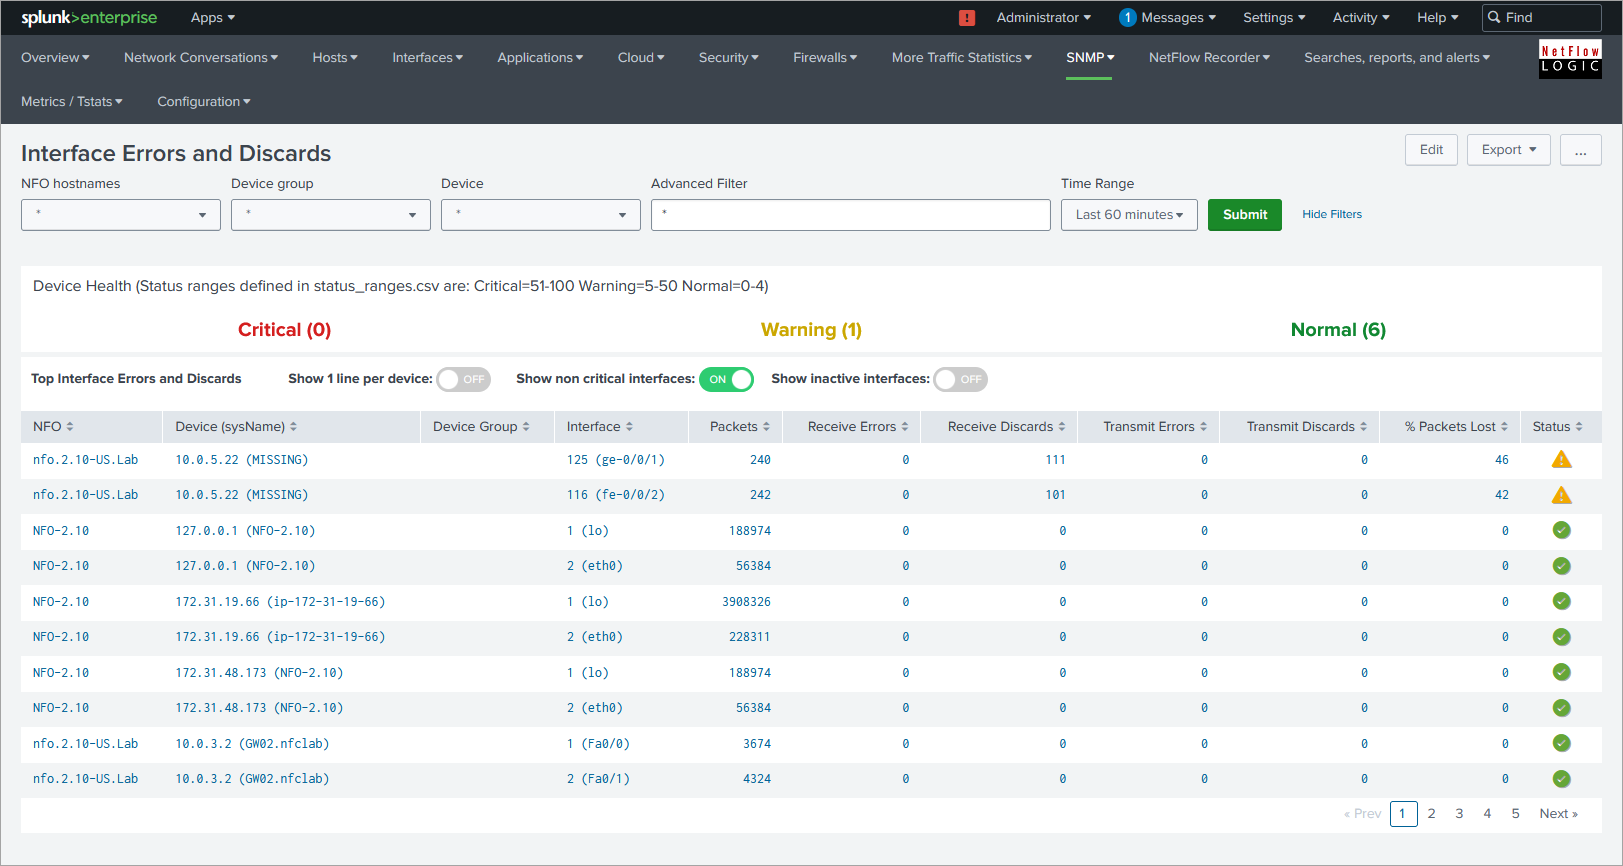
It relies on events sent to Splunk by NFO SNMP Custom OID Sets Monitor Module fields defined in interface_mon OID set. This dashboard utilizes the following lookup files:
- snmp-devices.csv
- critical_interfaces.csv
The snmp-devices.csv file is populated by a saved search that runs every 30 minutes. You can trigger this search on the setup page by clicking the "update dropdowns" button.
To utilize the "Show non-critical interfaces" toggle, ensure the critical_interfaces.csv lookup file is set up correctly. Below is a sample of the critical_interfaces.csv lookup file:
nfo_hostname,"management_ip","snmp_index","ifName","ifAlias","comment"
localhost","10.0.3.2",1,"VLAN1","VLAN1001","Important interface"
localhost",10.0.5.22,116,"VLAN2","VLAN1002","Uplink"
SNMP Devices CPU and Memory
This dashboard provides network device health based on CPU and memory utilization, as depicted below:

It relies on events sent to Splunk by NFO SNMP Custom OID Sets Monitor Module. The following fields should be defined in this Module OID sets:
-
For CPU utilization:
cpu_load_percent -
For memory utilization: either
mem_used_percentor any two of the following OIDs:mem_used,mem_free, ormem_total