Elasticsearch Integration
You can integrate NetFlow Optimizer with Elasticsearch by sending data over UDP protocol in JSON forman using Filebeat or Logstash or both.
Important: configure NFO output format as JSON
Using Filebeat
Filebeat has a small footprint and enables you to ship your flow data to Elasticsearch securely and reliably. Please note that Filebeat cannot add calculated fields at index time, and Logstash can be used with Filebeat if this is required. The steps below describe NFO -> Filebeat -> Elasticsearch - Kibana scenario.
Installation Steps
Install the following components:
- Filebeat: https://www.elastic.co/guide/en/beats/filebeat/current/filebeat-installation-configuration.html
- Elasticsearch: https://www.elastic.co/guide/en/elasticsearch/reference/current/install-elasticsearch.html
- Kibana: https://www.elastic.co/guide/en/kibana/current/install.html
- Make sure all services are running
Configure Filebeat
- Download nfo_fields.yml and add the nfo_fields.yml file to the filebeats configuration directory (e.g
/etc/filebeat). This file contains the NFO field definitions for the template - In the filebeats configuration directory edit the filebeat.yml file - Add after the ‘filebeat.inputs:’ line the following:
- type: udp
  max_message_size: 10KiB
  host: "0.0.0.0:5514"
where 5514 is the filebeat input port (it should match NFO UDP output port)
- After the ‘setup.template.settings:’ line add the following:
setup.template.enabled: true
setup.template.name: "nfo"
setup.template.pattern: "nfo-*"
setup.template.fields: "nfo_fields.yml"
setup.template.overwrite: true
#if ilm.enabled is set to false then in the outputs a custom index name can be specified
setup.ilm.enabled: false
- In the ‘output.elasticsearch:’ section add the index filename, for example:
Output.elasticsearch:
  # Array of hosts to connect to.
  hosts: ["localhost:9200"]
  index: "nfo-%{+yyyy.MM.dd}"
- In the processors section add this:
- decode_json_fields:
  fields: ["message"]
  target: ""
  overwrite_keys: true
- Restart filebeat service
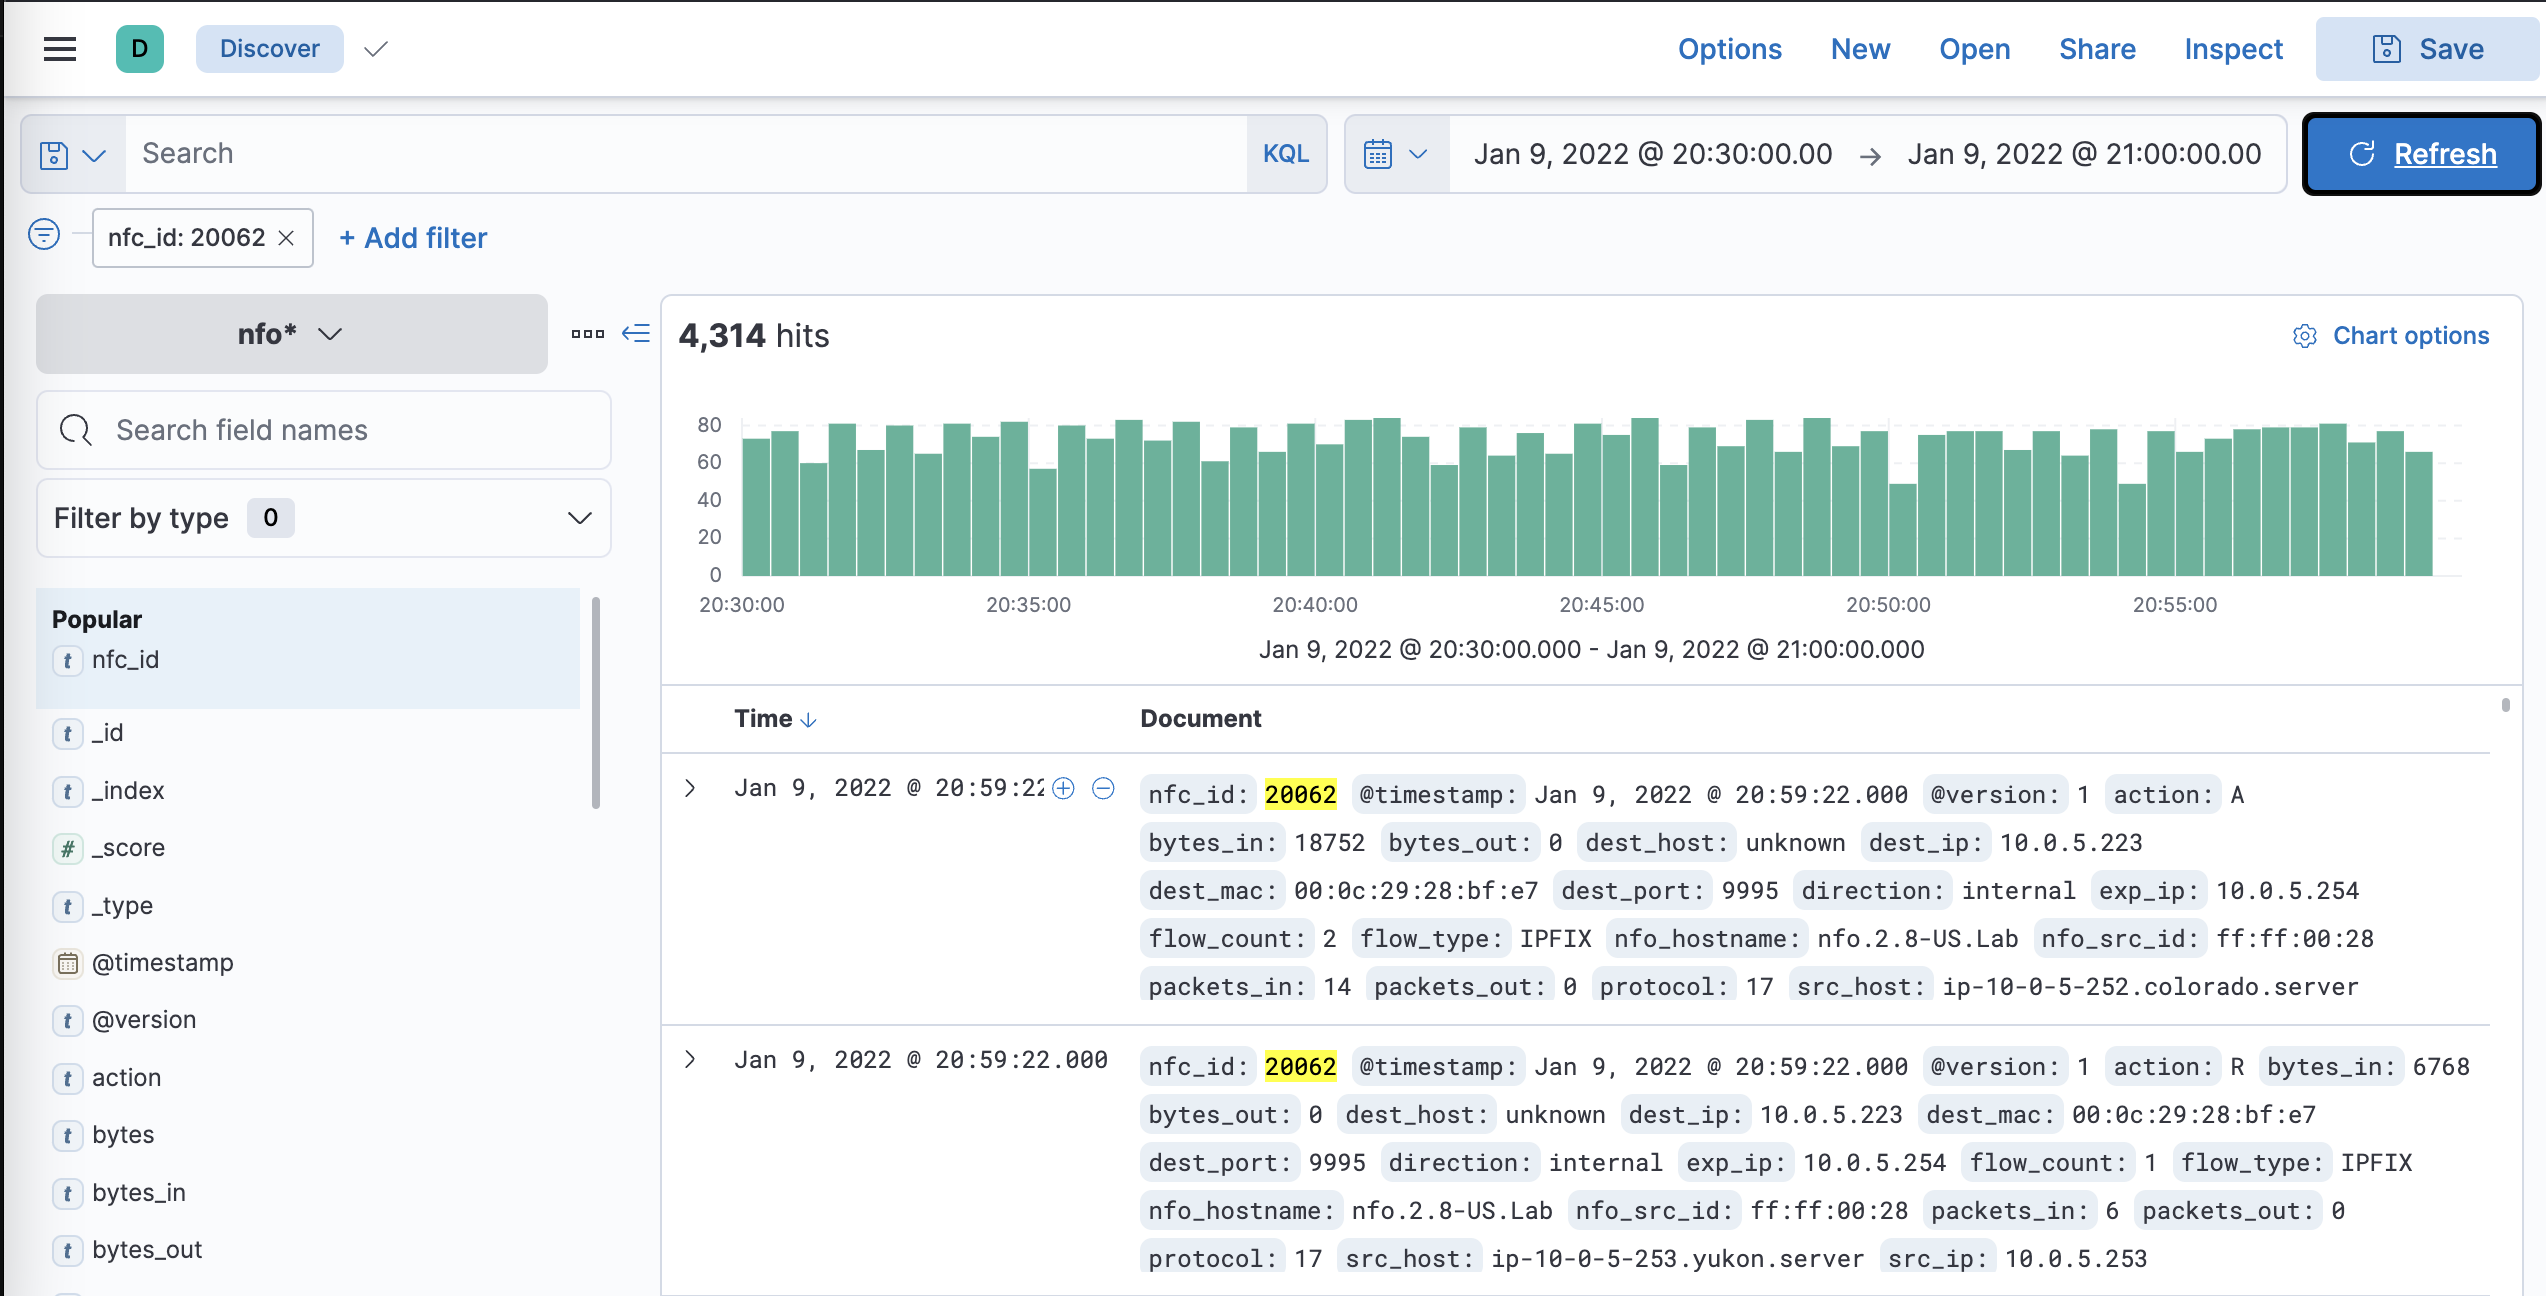
Configure Kibana
- In kibana.yml set host and port
- In Kibana go to (port 5601)
%Kibana_server%/app/management/kibana/indexPatterns - Define the new index pattern
Using Logstash
Logstash has a larger footprint, but enables you to filter and transform data, adding calculated fields at index time, if necessary.
Installation Steps
Install the following components:
- Logstash: https://www.elastic.co/guide/en/logstash/current/installing-logstash.html
- Elasticsearch: https://www.elastic.co/guide/en/elasticsearch/reference/current/install-elasticsearch.html
- Kibana: https://www.elastic.co/guide/en/kibana/current/install.html
- Make sure all services are running
Configure Logstash
- Download and add the following files to the logstash configurations conf.d directory (e.g.
/etc/logstash/conf.d): nfo_mapping.json nfo.conf - Modify input and output sections of
nfo.confto match your environment:
input {
  udp {
    port => 5514
    codec => json
  }
}
where 5514 is the logstash input port (it should match NFO UDP output port)
output {
  elasticsearch {
    hosts => ["http://<elasticsearch host IP>:9200"]
    index => "nfo-logstash-%{+yyyy.MM.dd}"
    template => "/etc/logstash/conf.d/nfo_mapping.json"
    template_name => "nfo*"
  }
}
- Restart Logstash service
Configure Kibana
- In kibana.yml set host and port
- In Kibana go to (port 5601)
%Kibana_server%/app/management/kibana/indexPatterns - Define the new index pattern