SNMP Custom OID Sets Monitor (10103 / 20103)
Description
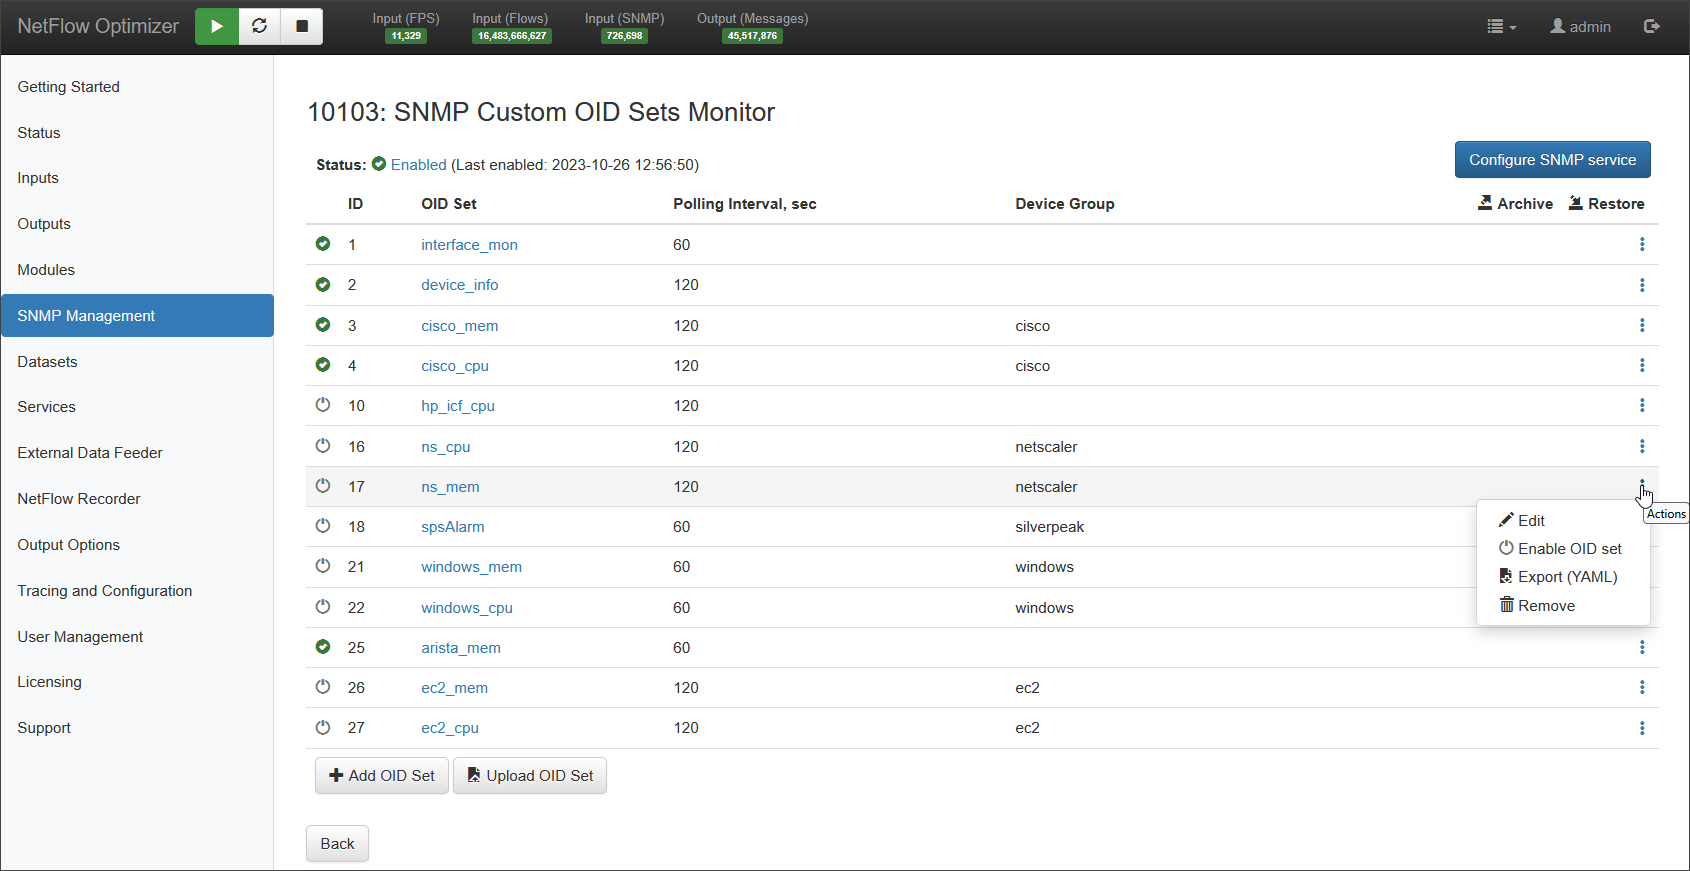
This Module enables you to perform SNMP polling from network devices by creating OID Sets. Each set can contain up to 64 OIDs, and has its own polling interval. The polling is performed for all network devices configured in SNMP Service, taking into account Device Group. The information is provided per device-OID set.
Parameters
| Parameter Name | Description | Comments |
|---|---|---|
| SNMP OIDs Monitor | Module logic execution interval | 10 sec (fixed value) |
| OID Set | You may create unlimited number of OID sets by specifying the following: - OID Set name; - Data collection interval; - Device Group; - Up to 64 OIDs | You build your OID sets by going through SNMP tree and selecting OIDs. Once selected, they are added to the Set |
Configuring OID Sets
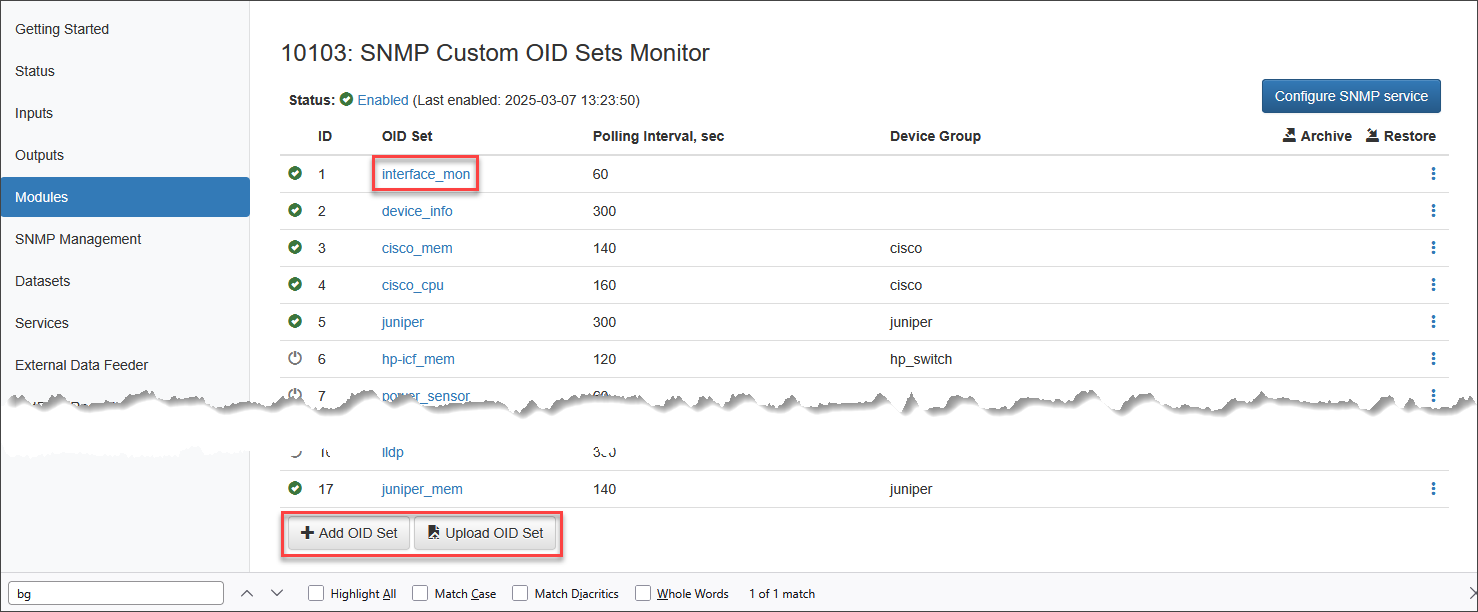
There are two options for creating Custom OID sets.
To create a new OID set, click on ![]() button, which will open the following popup window:
button, which will open the following popup window:
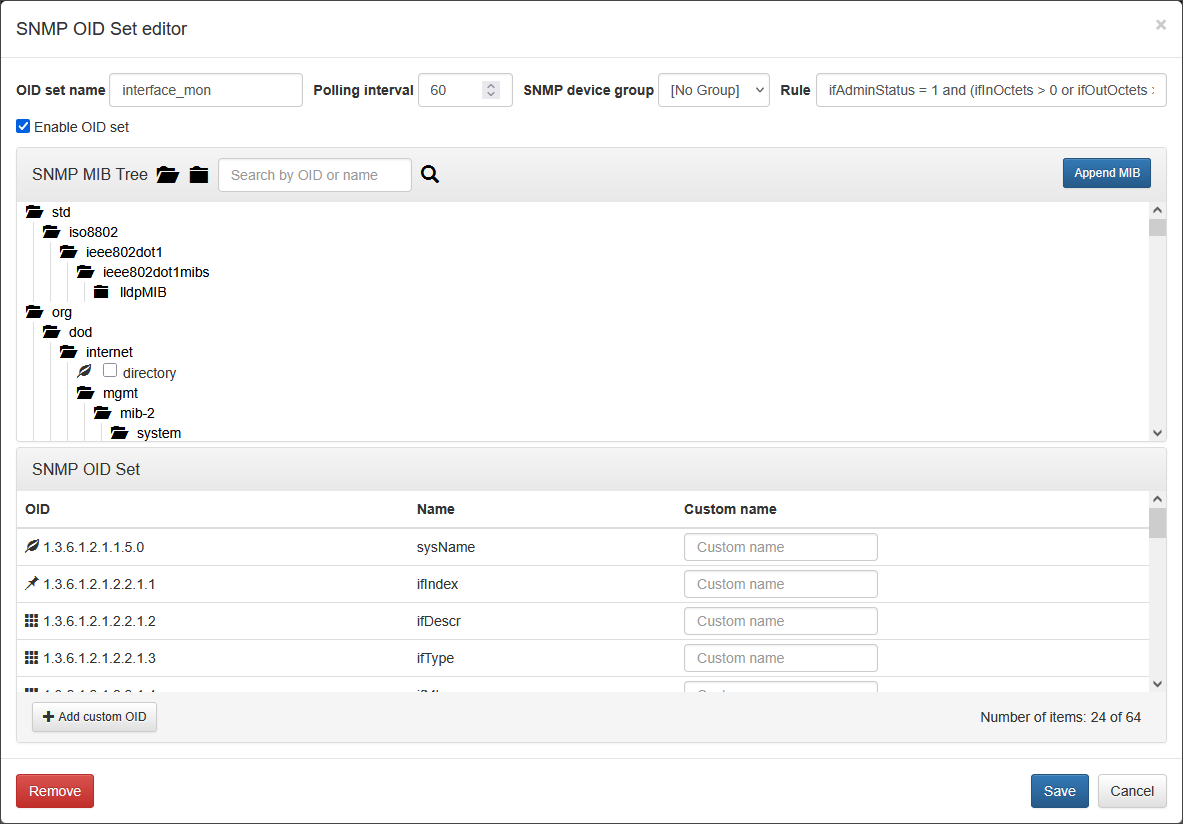
In this window:
- OID Set name: the name of your custom OID set. It is exported as key-value pair ois_set_name=
your_set_name - Data Collection Interval: SNMP polling interval for this OID set
- SNMP device group: this is an optional parameter. You can assign this OID set to a specific group, defined in the List of devices while configuring the SNMP Management
- Rule: the rule to filter the SNMP data. For details, see Configuring Rules
- OID elements: you can build a list of OIDs, selecting them by clicking check boxes
If your OID is not in the tree, you can add an SNMP MIB, containing the required OID by clicking the ![]() button.
button.
The second option is upload OID set YAML configuration by clicking on the ![]() button.
button.
Here is an example of OID set YAML to monitor CPU utilization of Cisco devices:
---
#
# OID set for Cisco CPU
# MIB: SNMPv2-MIB (preloaded)
# MIB: CISCO-PROCESS-MIB https://www.circitor.fr/Mibs/Mib/C/CISCO-PROCESS-MIB.mib
#
oidSet: "cisco_cpu" # [string] Name of OID set
interval: 120 # [number] SNMP polling interval
deviceGroup: "cisco" # [string] Device Group
enabled: true # [boolean] true / false
objects:
- oid: "1.3.6.1.2.1.1.5.0" # [string] OID
  customName: "sysName" # [string] OID name (Optional if MIB is loaded into NFO) or custom name
  type: # [string] Scalar, TableIndex, or TableEntry. Optional if MIB is loaded into NFO
# - oid: "1.3.6.1.4.1.9.9.109.1.1.1.1.7" # cpmCPUTotal1minRev
#   customName: "cpu_load_percent"
#   type: TableEntry # [string] Scalar, TableIndex, or TableEntry. Optional if MIB is loaded into NFO
- oid: "1.3.6.1.4.1.9.9.109.1.1.1.1.8" # cpmCPUTotal5minRev
  customName: "cpu_load_percent"
  type: TableEntry # [string] Scalar, TableIndex, or TableEntry. Optional if MIB is loaded into NFO
...
This OID set YAML is to monitor memory utilization of Cisco devices:
---
#
# OID set for Cisco memory
# MIB: SNMPv2-MIB (preloaded)
# MIB: CISCO-MEMORY-POOL-MIB https://www.circitor.fr/Mibs/Mib/C/CISCO-MEMORY-POOL-MIB.mib
#
oidSet: "cisco_mem" # [string] Name of OID set
interval: 120 # [number] SNMP polling interval
deviceGroup: "" # [string] Device Group. Make sure Device Group is present in the list of devices
enabled: true # [boolean] true / false
objects:
- oid: "1.3.6.1.2.1.1.5.0" # [string] OID
  customName: "sysName" # [string] OID name (Optional if MIB is loaded into NFO) or custom name
  type: # [string] Scalar, TableIndex, or TableEntry. Optional if MIB is loaded into NFO
- oid: "1.3.6.1.4.1.9.9.48.1.1.1.5" # ciscoMemoryPoolUsed
  customName: "mem_used"
  type: TableEntry # [string] Scalar, TableIndex, or TableEntry. Optional if MIB is loaded into NFO
- oid: "1.3.6.1.4.1.9.9.48.1.1.1.6" # ciscoMemoryPoolFree
  customName: "mem_free"
  type: TableEntry # [string] Scalar, TableIndex, or TableEntry. Optional if MIB is loaded into NFO
...
For additional YAML configurations, please contact support@netflowlogic.com.
You can also modify an exisitng OID set by clicking on its name.
Configuring Rules
This section explains how to define rules to filter the SNMP data collected by the Module. These rules allow you to specify conditions under which an entire OID set or a particular table row should be reported, significantly reducing the volume of data sent downstream.
The rules are expressed through custom logical and comparison expressions using OID symbolic names as variables. This mechanism provides fine-grained control over your SNMP telemetry.
Potential Applications
The primary use case for these rules is volume reduction, which is essential when monitoring high-volume data sources like network interfaces. By filtering out unneeded metrics at the source, you can significantly reduce the amount of reported SNMP data.
Additionally, these rules have numerous other applications, such as reporting temperature sensors only when their reading exceeds a threshold, collecting LLDP neighbors with specified capabilities, or filtering devices with low battery levels.
Rule Expression Grammar
The grammar for these expressions supports a wide range of operators and functions:
- Unary Operations:
not(!), negation (-), bitwise inversion (~) - Binary Operators:
+,-,*,/,|(bitwise OR),&(bitwise AND),^(bitwise XOR) - Logical Operators:
and(&&),or(||) - Test Operators:
=,!=(<>),>,>=,<,<= - String Functions:
equals,contains,startsWith,endsWith - Grouping: Parentheses
()for grouping expressions - Literals:
uint64andfloatnumbers,string(in quotes), andvariable names(using the OID symbolic name or alias from your set).
Examples
- Filter Interfaces by Status and Activity: When requesting
ifTableentries from IF-MIB, you might want to report only active interfaces with traffic:ifAdminStatus = 1 and (ifInOctets > 0 or ifOutOctets > 0) - Report Devices with High CPU Utilization: To focus on performance issues, you can report only devices with high CPU load:
cpmCPUTotal5minRev > 90 - Filter Interfaces by Name: You can filter interfaces based on a string match, for example, to report only interfaces with names starting with "eth":
ifName.startsWith("eth")
Rule expression can be specified in OID set YAML file in ruleExpr: element. Here is an example with the rule to monitor only active interfaces:
---
#
# OID set for Interface monitoring
# MIB: SNMPv2-MIB (preloaded)
#
oidSet: "interface_mon" # [string] Name of OID set
interval: 60 # [number] SNMP polling interval
deviceGroup: "" # [string] Device Group - left blank as this is a generic MIB
ruleExpr: "ifAdminStatus = 1 and (ifInOctets > 0 or ifOutOctets > 0)" # Report only active interfaces
enabled: true
objects:
- oid: "1.3.6.1.2.1.1.5.0"
  customName: "sysName"
  type: "Scalar"
- oid: "1.3.6.1.2.1.2.2.1.1"
  customName: "ifIndex"
  type: "TableIndex"
- oid: "1.3.6.1.2.1.2.2.1.2"
  customName: "ifDescr"
  type: "TableEntry"
- oid: "1.3.6.1.2.1.2.2.1.3"
  customName: "ifType"
  type: "TableEntry"
- oid: "1.3.6.1.2.1.2.2.1.4"
  customName: "ifMtu"
  type: "TableEntry"
- oid: "1.3.6.1.2.1.2.2.1.5"
  customName: "ifSpeed"
  type: "TableEntry"
- oid: "1.3.6.1.2.1.2.2.1.6"
  customName: "ifPhysAddress"
  type: "TableEntry"
- oid: "1.3.6.1.2.1.2.2.1.7"
  customName: "ifAdminStatus"
  type: "TableEntry"
- oid: "1.3.6.1.2.1.2.2.1.8"
  customName: "ifOperStatus"
  type: "TableEntry"
- oid: "1.3.6.1.2.1.2.2.1.10"
  customName: "ifInOctets"
  type: "TableEntry"
- oid: "1.3.6.1.2.1.2.2.1.11"
  customName: "ifInUcastPkts"
  type: "TableEntry"
- oid: "1.3.6.1.2.1.2.2.1.12"
  customName: "ifInNUcastPkts"
  type: "TableEntry"
- oid: "1.3.6.1.2.1.2.2.1.13"
  customName: "ifInDiscards"
  type: "TableEntry"
- oid: "1.3.6.1.2.1.2.2.1.14"
  customName: "ifInErrors"
  type: "TableEntry"
- oid: "1.3.6.1.2.1.2.2.1.16"
  customName: "ifOutOctets"
  type: "TableEntry"
- oid: "1.3.6.1.2.1.2.2.1.17"
  customName: "ifOutUcastPkts"
  type: "TableEntry"
- oid: "1.3.6.1.2.1.2.2.1.18"
  customName: "ifOutNUcastPkts"
  type: "TableEntry"
- oid: "1.3.6.1.2.1.2.2.1.19"
  customName: "ifOutDiscards"
  type: "TableEntry"
- oid: "1.3.6.1.2.1.2.2.1.20"
  customName: "ifOutErrors"
  type: "TableEntry"
- oid: "1.3.6.1.2.1.31.1.1.1.1"
  customName: "ifName"
  type: "TableEntry"
- oid: "1.3.6.1.2.1.31.1.1.1.6"
  customName: "ifHCInOctets"
  type: "TableEntry"
- oid: "1.3.6.1.2.1.31.1.1.1.10"
  customName: "ifHCOutOctets"
  type: "TableEntry"
- oid: "1.3.6.1.2.1.31.1.1.1.15"
  customName: "ifHighSpeed"
  type: "TableEntry"
- oid: "1.3.6.1.2.1.31.1.1.1.18"
  customName: "ifAlias"
  type: "TableEntry"
...
Syslog/JSON Message Fields
| Key | Field Description | Comments |
|---|---|---|
| nfc_id | Message type identifier | “nfc_id=20103” |
| exp_ip | Device NetFlow Exporter IP address | IPv4_address or IPv6_address |
| mgmt_ip | Device Management IP address | IPv4_address or IPv6_address |
| oid_set | Name of OID Set | string |
| device_group | Name of Device Group, if selected | string |
| device_type | Device Type | string, e.g. "router", "firewall", "switch", "power", etc. |
| … | [Varies depending on OIDs in the set] | … |
Reporting OID Sets
The success of SNMP polling and the subsequent data collection heavily rely on the availability and responsiveness of the polled devices. Depending on the device status and the specific OIDs queried, the following outcomes may occur:
| Potential issues | Output |
|---|---|
| Device is unresponsive | None. Check the log for unresponsive devices: nfo_audit.log |
| Requested OID is not supported by the device | The OID is not included in the output |
| Returned value is unavailable, not valid, e.g. wrong type, lenth, etc. | "" |
Default OID Sets
The following OID Sets are included in NFO.
| Set Name | Polling Interval | Device Group | Description |
|---|---|---|---|
| interface_mon | 120 | Monitors network interface performance and health using standard and high-capacity (64-bit) OIDs like ifHCInOctets, ifHCOutOctets, and ifOperStatus. This set tracks bandwidth utilization, packet error rates, and physical/administrative states across all physical and logical ports. | |
| device_info | 120 | Provides fundamental system identification using core MIB-II OIDs like sysDescr, sysObjectID, and sysName. This generic set captures essential metadata, including device uptime and total interface count (ifNumber), to support baseline inventory and classification across all discovered assets. | |
| cisco_cpu | 120 | Cisco | Tracks Cisco-specific CPU utilization using authoritative OIDs like cpmCPUTotal1minRev and cpmCPUTotal5minRev to identify compute bottlenecks. |
| cisco_mem | 120 | Cisco | Monitors Cisco memory pool health via cempMemPoolUsed and cempMemPoolFree to detect leaks and prevent performance degradation. |
| cisco_old_mem | 120 | Cisco | Deprecated |
| cisco_fan | 300 | Cisco | Reports operational states and descriptions for chassis cooling systems using ciscoEnvMonFanState to prevent hardware overheating. |
| cisco_temp | 120 | Cisco | Measures thermal health against shutdown thresholds using ciscoEnvMonTemperatureStatusValue to protect hardware from heat damage. |
| cisco_psu | 120 | Cisco | Monitors power supply operational status and source using ciscoEnvMonSupplyState and ciscoEnvMonSupplySource to detect hardware failures. |
| cisco_firewall_mon | 120 | Cisco Firewall | Tracks firewall-specific connection metrics using specialized OIDs like cfwConnectionStatCount and cfwConnectionStatValue to monitor session load and state. |
| host_cpu | 120 | host | Monitors processor load via the standard hrProcessorLoad OID. This set provides cross-vendor compute utilization metrics for servers, workstations, and supported network devices like HP and Arista. |
| host_mem | 120 | host | Monitors memory allocation and usage through standard OIDs like hrStorageSize and hrStorageUsed. This set provides cross-vendor memory utilization metrics for servers, workstations, and network devices from HP (Aruba), Arista, and others. |
| bgp_peer_mon | 120 | Router | Monitors BGP routing stability and neighbor sessions using OIDs like bgpPeerState and bgpPeerIdentifier. This set tracks session uptime and update traffic (bgpPeerInUpdates/OutUpdates) to ensure reliable core network connectivity. |
| ospf_nbr_mon | 120 | Router | Monitors OSPF adjacency and neighbor states using OIDs like ospfNbrState and ospfNbrRtrId. This set identifies routing topology changes and neighbor relationship failures to ensure interior gateway protocol (IGP) stability. |
| ospf_virt_nbr_mon | 120 | Router | Monitors OSPF virtual link adjacency and neighbor states using OIDs like ospfVirtNbrState and ospfVirtNbrRtrId. This set identifies connectivity issues across virtual transit areas to maintain OSPF backbone integrity. |
| power_ethernet_mon | 300 | Monitors Power over Ethernet (PoE) delivery and status using OIDs like pethMainPsePower and pethMainPseConsumptionPower. This set tracks operational status and power consumption levels to ensure proper supply to connected PoE devices. | |
| printer_alerts | 120 | Printer | Monitors printer-specific hardware status and error conditions using OIDs like prtAlertDescription, prtAlertSeverityLevel, and prtAlertCode. This set identifies operational issues and maintenance requirements across networked printer fleets. |
| spanning_tree_proto_health | 300 | Switch | Monitors Spanning Tree Protocol (STP) stability using OIDs like dot1dStpTopChanges and dot1dStpPortState. This set identifies topology shifts and port status transitions to prevent Layer 2 loops and ensure network path redundancy. |
| pan_sessions | 120 | PAN Firewall | Tracks Palo Alto Networks session load and utilization using OIDs like panSessionUtilization, panSessionActive, and panSessionMax. This set monitors active TCP, UDP, ICMP, and SSL Proxy sessions to provide visibility into firewall capacity and traffic patterns. |
| pan_vsys_sessions | 120 | PAN Firewall | Tracks session utilization across Palo Alto Networks virtual systems (vsys) using OIDs like panVsysSessionUtilizationPct and panVsysActiveSessions. This set provides granular visibility into active TCP, UDP, and OtherIP sessions per virtual instance to ensure multi-tenant firewall performance. |
| ups_common | 300 | UPS | Monitors Uninterruptible Power Supply (UPS) health and battery capacity using OIDs like upsBatteryStatus, upsEstimatedMinutesRemaining, and upsBatteryVoltage. This set identifies power input issues and battery depletion to ensure runtime during facility power failures. |
| ups_alarms | 120 | UPS | Reports real-time Uninterruptible Power Supply (UPS) fault conditions using OIDs like upsAlarmDescr and upsAlarmTime. This set identifies specific system failures and critical event timing to facilitate rapid incident response. |
| ups_input_lines | 300 | UPS | Monitors the quality and stability of incoming utility power using OIDs like upsInputVoltage, upsInputFrequency, and upsInputTruePower. This set tracks electrical metrics per input line to identify power fluctuations or brownouts before they impact downstream equipment. |
| ups_output_lines | 300 | UPS | Monitors power delivery quality from the UPS to protected equipment using OIDs like upsOutputVoltage, upsOutputPower, and upsOutputPercentLoad. This set tracks load levels per output line to prevent circuit overloads and ensure stable voltage regulation. |
| juniper_mon | 300 | Juniper | Monitors the health and performance of Juniper chassis components using specialized OIDs like jnxOperatingTemp, jnxOperatingCPU, and jnxOperatingMemory. This set provides real-time telemetry on operating states and buffer utilization across Junos devices. |
| juniper_spu_mon | 300 | Juniper Firewall | Monitors Juniper Services Processing Unit (SPU) performance using specialized OIDs like jnxJsSPUMonitoringCurrentFlowSession and jnxJsSPUMonitoringMaxFlowSession. This set tracks security flow sessions and SPU-specific CPU/memory utilization to ensure high-performance firewall and VPN processing. |