Version: 2.10.2

Integration with Splunk Observability Cloud

You can integrate NetFlow Optimizer (NFO) with Splunk Observability Cloud, both Metrics and Log Observer.

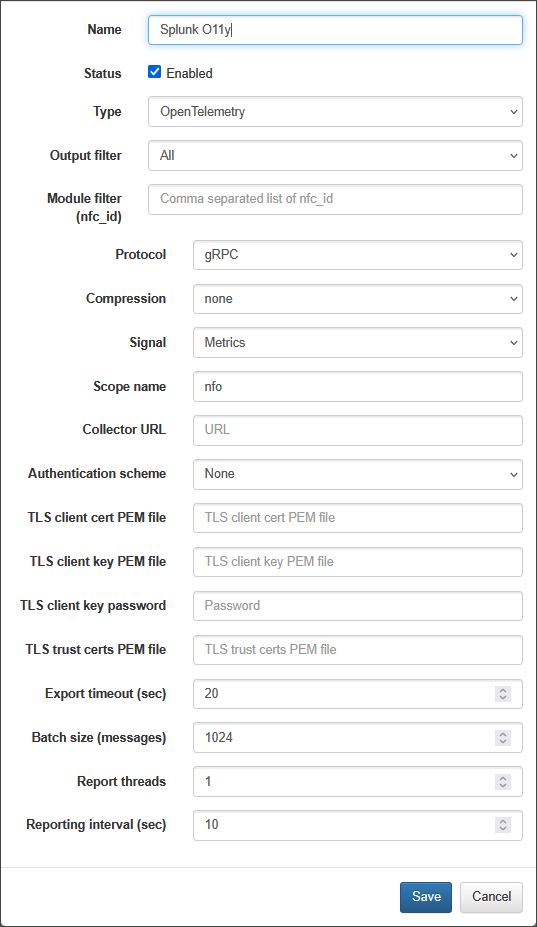
To send NFO output to Metrics, select NFO output type Splunk Observability Metrics.

To send NFO output to Log Observer, send NFO output to Splunk Connect for Syslog (SC4S): https://splunkbase.splunk.com/app/4740/ and configure SC4S forwarding to Splunk Observability Cloud.

Configuring NFO Output to Splunk Observability Cloud Metrics

Configuration Steps

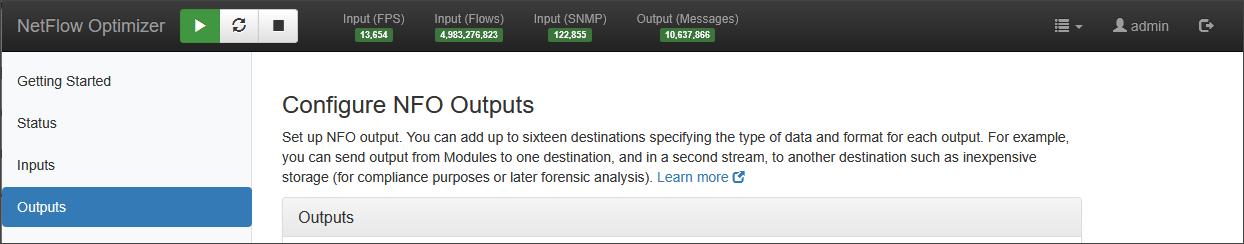
Select Output on the left navigation menu and click on the plus sign (+)

Enter required information in the popup window:

On this form enter the following:

  1. Name (optional): e.g. SignalFX
  2. Status: Enable
  3. Type: Select Splunk Observability Metrics
  4. Output filter: Select Modules Output only
  5. Access token: Enter your organization Ingest token. For more information, visit https://dev.splunk.com/observability/docs/administration/authtokens/#Organization-access-tokens
  6. Realm: Enter your realm (e.g. us0 or eu0)
  7. Source name: Enter Source Name - this field is sent as "sf_source" property (default is nfo)
  8. Report threads: Enter output threads count (default is 2). This is the number of threads allocated to receive NetFlow data messages produced by NFO and sent to Splunk Observability Cloud
  9. Report interval (sec): Enter interval in seconds between report threads executions (default is 10)
  10. Max body size (bytes): Enter maximum size of each report message payload (before compression) (default is 40,000)
  11. Socket timeout (sec): Enter socket and connection timeout (default is 10)
  12. nfc_id filter: the list of NFO Modules' nfc_ids to be sent to Splunk Observability Cloud Metrics. This is optional parameter, if not set, all messages are sent
  13. Press Save to apply your configurations

Custom Fields Configuration

There are three metric types in the Splunk Observability Cloud https://docs.splunk.com/observability/metrics-and-metadata/metric-types.html: gauges, counters and cumulative counters.

NFO allows to configure metric types per NFO Module (nfc_id) and field label.

To configure custom nfc_id and field labels mapping edit /opt/flowintegrator/etc/signalfx.conf file and enable/disable the output. Default signalfx.conf is:

# This file contains possible settings you can use to configure NFO output to 
# Splunk Observability Cloud (SignalFX) Metrics data
#
# Each stanza controls outputs from different NFO Modules, identified in NFO syslogs
# with nfc_id field.
#
# Use the [default] stanza to define any global settings. Use [<nfc_id>] stanza to define
# NFO Module specific output fields.
#
# Format
# [default | <nfc_id>]
# <field_label> = dimension | counter | cum_counter | gauge | none
# * = dimension | gauge | counter | cum_counter
#
# Where:
#
# <nfc_id> is the nfc_id field in NFO syslog message produced by a specific NFO Logic Module.
#
# <field_label> is a syslog field label.
#
# * = counter means that all undefined numeric fields are converted to counters.
# * = dimension means that all undefined string fields are sent as dimensions.
#
# Both definitions may be used:
# * = counter
# * = dimension
# indicates that all numeric fields are mapped to metrics, and all string fields are mapped as dimensions.

[default]
nfc_id = dimension
exp_ip = dimension
bytes_in = counter
bytes_out = counter
packets_in = counter
packets_out = counter
t_int = none
* = gauge
* = dimension

[20103]
nfc_id = dimension
exp_ip = none
mgmt_ip = dimension
sysName = dimension
ifIndex = dimension
ifName = dimension
ifAlias = dimension
ifDescr = dimension
ifType = dimension
ifMtu = dimension
ifSpeed = dimension
ifPhysAddress = dimension
ifAdminStatus = dimension
ifOperStatus = dimension
ifInUcastPkts = cum_counter
ifInNUcastPkts = cum_counter
ifInDiscards = cum_counter
ifInErrors = cum_counter
ifOutUcastPkts = cum_counter
ifOutNUcastPkts = cum_counter
ifOutDiscards = cum_counter
ifOutErrors = cum_counter
ifInOctets = cum_counter
ifOutOctets = cum_counter
t_int = none
* = cum_counter
* = dimension

Splunk Observability Output Statistics

You can monitor Splunk Observability output statistics on the Status page (at the bottom of Statistics panel).

The following counts are available (shown only when Splunk Observability output is enabled):

  • Splunk Observability total input syslogs – total syslog messages produced by NFO to be processed by Splunk Observability Cloud output
  • Splunk Observability total accepted syslogs – total syslog messages converted to data points. Some syslogs could be dropped due to nfc_id filter parameter or invalid format
  • Splunk Observability total data points – total data points are sent to Splunk Observability Cloud. Each syslog message is converter to a several data points
  • Splunk Observability queue length – syslog messages queue. If queue length is growing, number of report threads have to be increased.
  • Splunk Observability queue size KB – syslog messages queue size in KB.