SNMP and NetFlow Data Monitoring Content Pack for ITEW
Introduction
NetFlow Logic's Content Pack extends ITEW's network monitoring capabilities by incorporating NetFlow and SNMP data. This powerful combination empowers IT teams to gain deeper insights into network performance, troubleshoot issues proactively, and optimize resource utilization.
By leveraging this Content Pack, organizations can automatically discover network devices and interfaces, monitor their health and performance, and correlate network data with other IT components within the ITEW framework.
This integration delivers comprehensive visibility into network infrastructure, facilitating efficient IT operations and incident response.
This Content Pack seamlessly integrates with ITEW, providing pre-built discovery searches for critical network entities and proactive event management through SNMP traps:
- Network Devices: Gain automatic discovery and monitoring of network devices within your infrastructure.
- Network Interfaces: Monitor individual network interfaces for detailed traffic insights and potential performance bottlenecks.
- SNMP Traps: Receive and correlate real-time alerts for network events, enabling rapid incident response.
Leveraging Macros, Transforms, and Saved Searches
The Content Pack utilizes macros, transforms, and saved searches to simplify network data management within ITEW. This streamlines the discovery and monitoring process, allowing you to focus on gaining valuable insights from your network data.
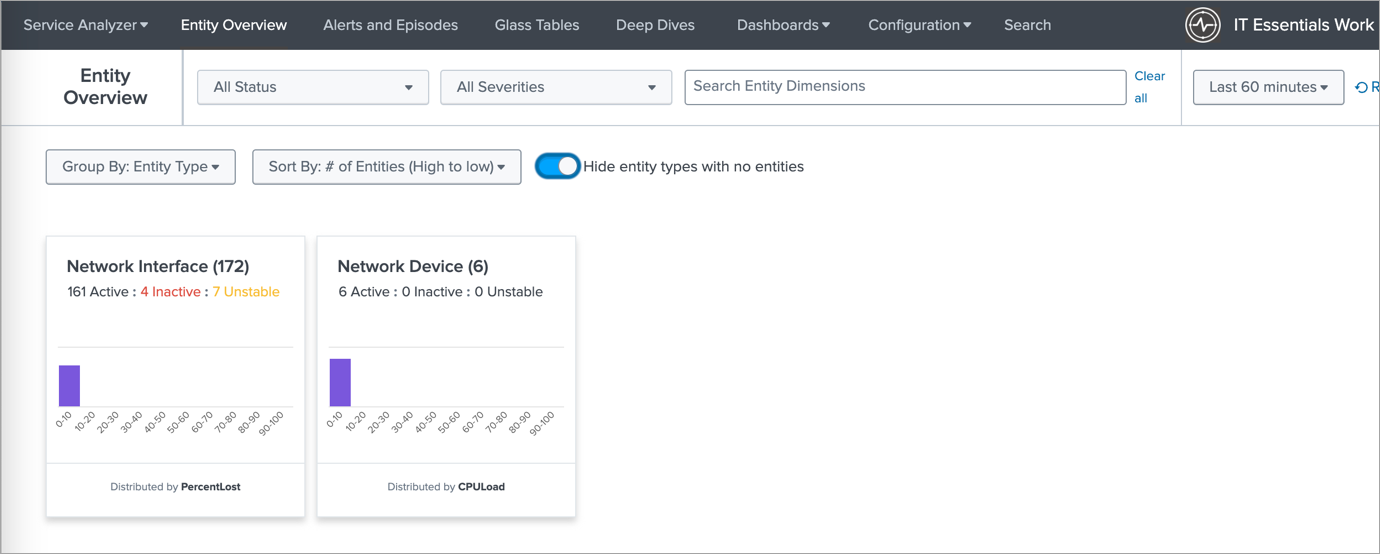
The image below displays the new Entity types introduced in this Content pack.
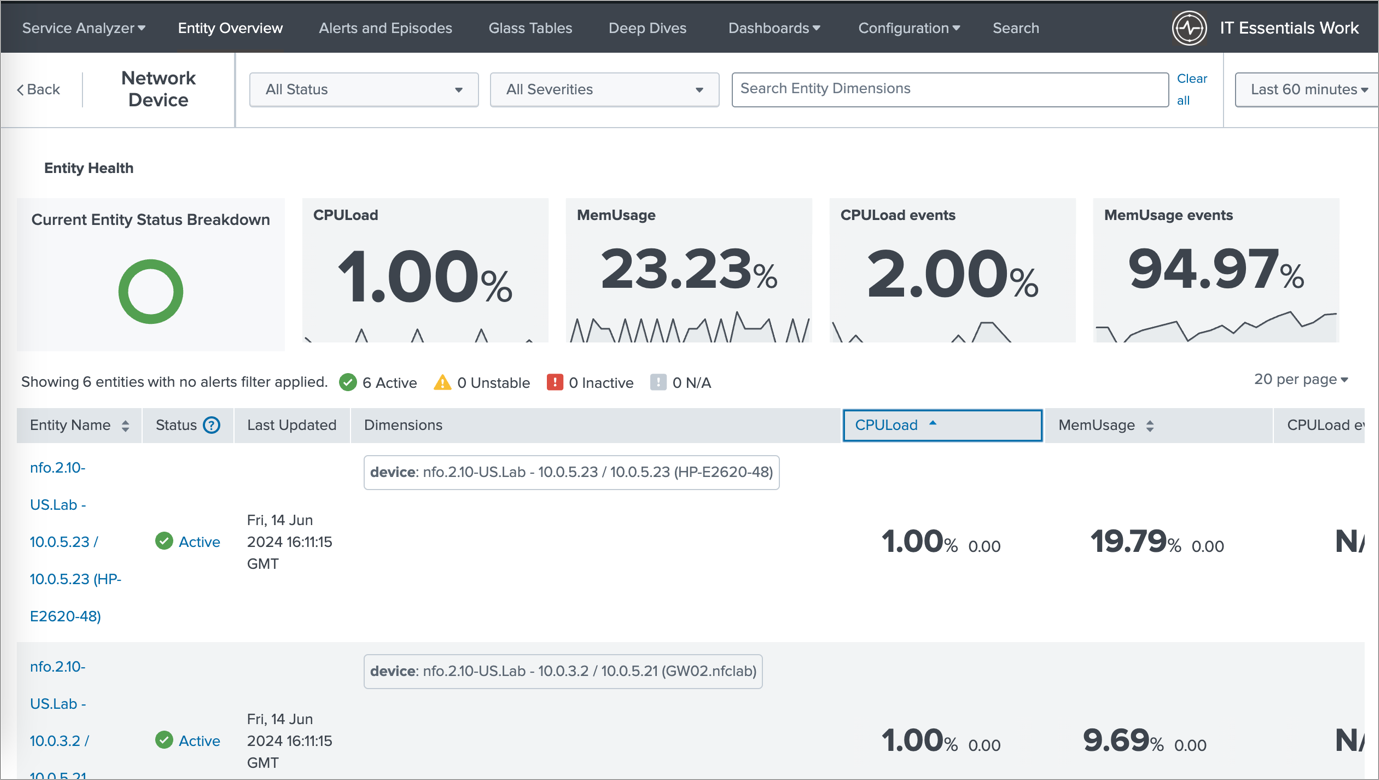
The next image showcases the list of entities displayed when you select a specific entity type (e.g., Network Devices). This allows you to easily navigate and manage your network devices within ITEW.
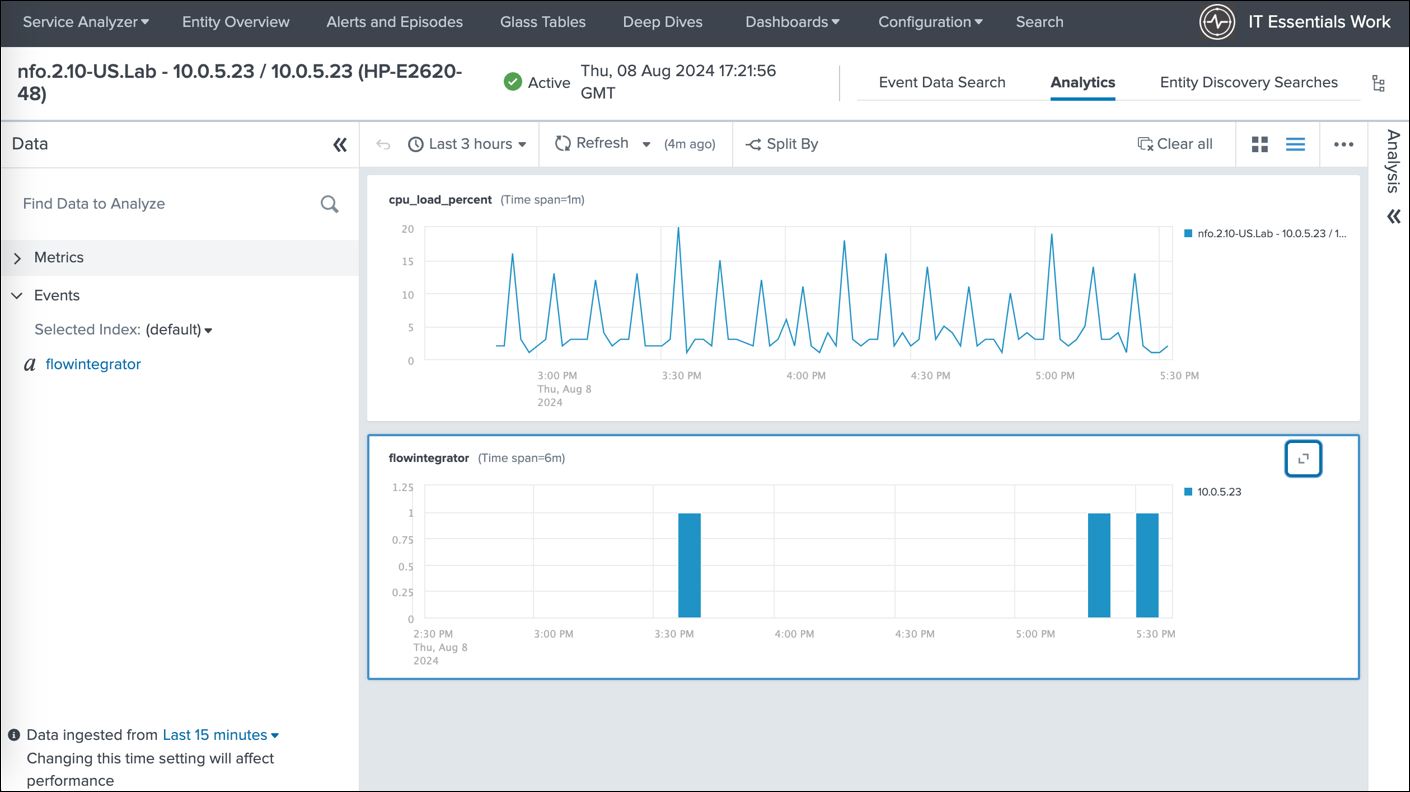
This image displays the stacked dashboard showing the CPU load and SNMP trap events, enabling you to correlate CPU performance with network alerts and identify potential root causes for performance issues.
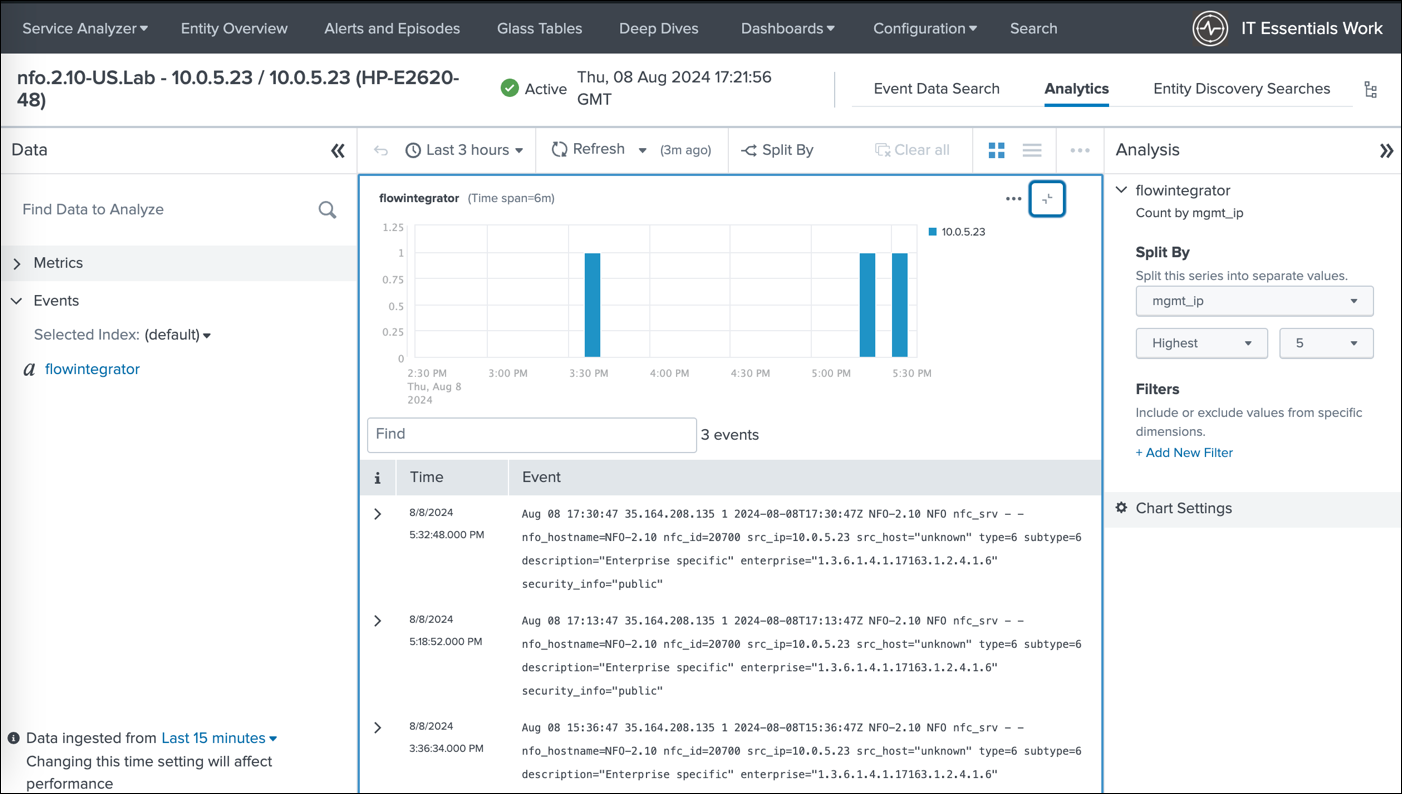
This image showcases the review of SNMP trap events in the Analytics dashboard.
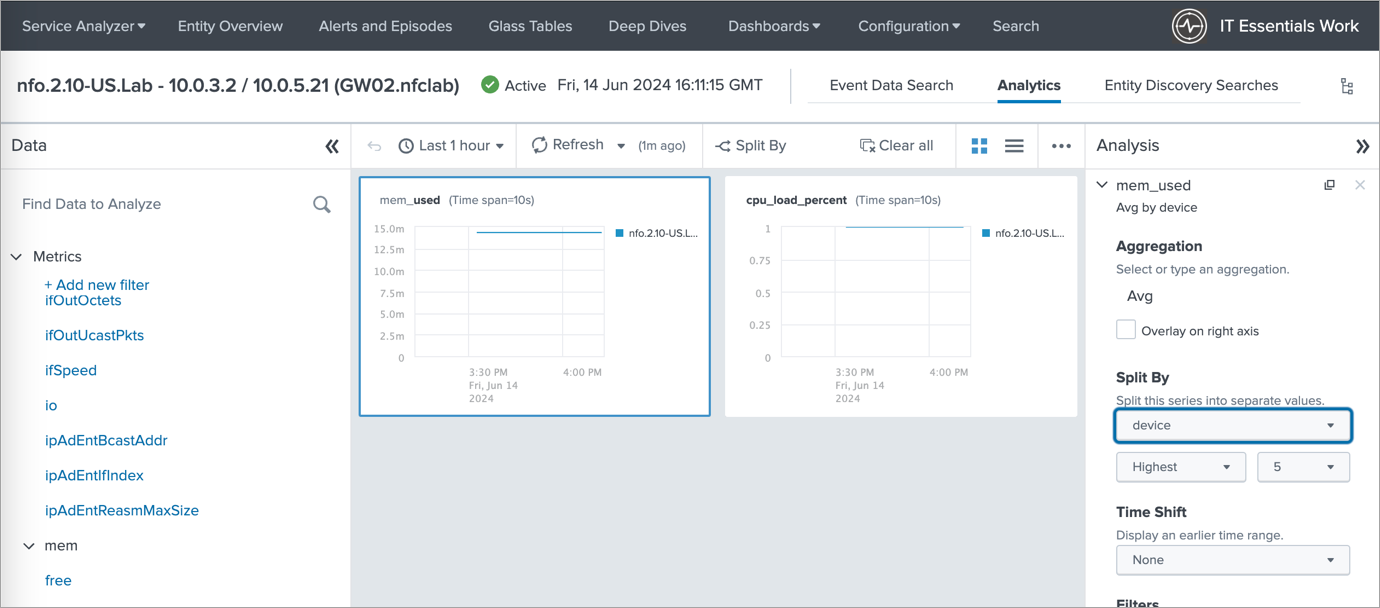
The final image demonstrates the ability to view analytics for a selected entity. This empowers you to analyze performance metrics, identify potential network issues, and gain valuable insights into your network health.
Prerequisites
Please be sure to have the following before you begin the installation of the Content Pack:
- NetFlow Optimizer (NFO) is installed in your environment
- Top Traffic Monitor Module is enabled (for optional NetFlow processing)
- SNMP Information Monitor is enabled (for data about interfaces, such as ifName, ifSpeed, etc.)
- SNMP Custom OID Sets Monitor Module is enabled (for SNMP polling of CPU and Memory utilization)
- NFO output is configured to send data to Splunk event index or metrics index
- Technology Add-On for NetFlow (TA-netflow) (https://splunkbase.splunk.com/app/1838/) installed on your Splunk Search Heads, Indexers, and Heavy Forwarders
The Content Pack relies on the following:
-
The data from SNMP polling, and optionally NetFlow data, is ingested into Splunk, either in the event index as defined by the
nfo_netflow_index macroor in the metrics index as defined by thenfo_netflow_index_metricsmacro. Both macros are provided within the Content Pack. -
The following fields are expected in SNMP polling events (nfc_id=20103):
- sysName
- exp_ip
- nfo_hostname
- mgmt_ip
- cpu_load_percent
- mem_used_percent
- mem_used
- mem_free
- mem_total
- ifName
- ifIndex
- ifInErrors
- ifOutErrors
- ifInDiscards
- ifOutDiscards
- ifInUcastPkts
- ifOutUcastPkts
- ifInNUcastPkts
- ifOutNUcastPkts
- ifHCInOctets
- ifHCOutOctets
- ifHighSpeed
For memory utilization you may need either mem_used_percent or any two of the following OIDs: mem_used, mem_free, or mem_total
- The following fields are expected in NetFlow events (nfc_id=20067) (if NetFlow data is used):
- exp_ip
- input_snmp
- output_snmp
- nfo_hostname
- flow_smpl_id
Installation and Configuration Steps
In this section, you'll find the step-by-step installation and configuration instructions.
1. Install the Content Pack into Splunk environment
Install the Content Pack in a single-instance Splunk Enterprise deployment
-
Download the Content Pack by clicking on the following link: https://splunk-netflow.s3.us-west-2.amazonaws.com/itsi-cp/DA-ITSI-CP-CUST-64e79cc8cadcb104d97b7703_1_0_9.tar.gz
-
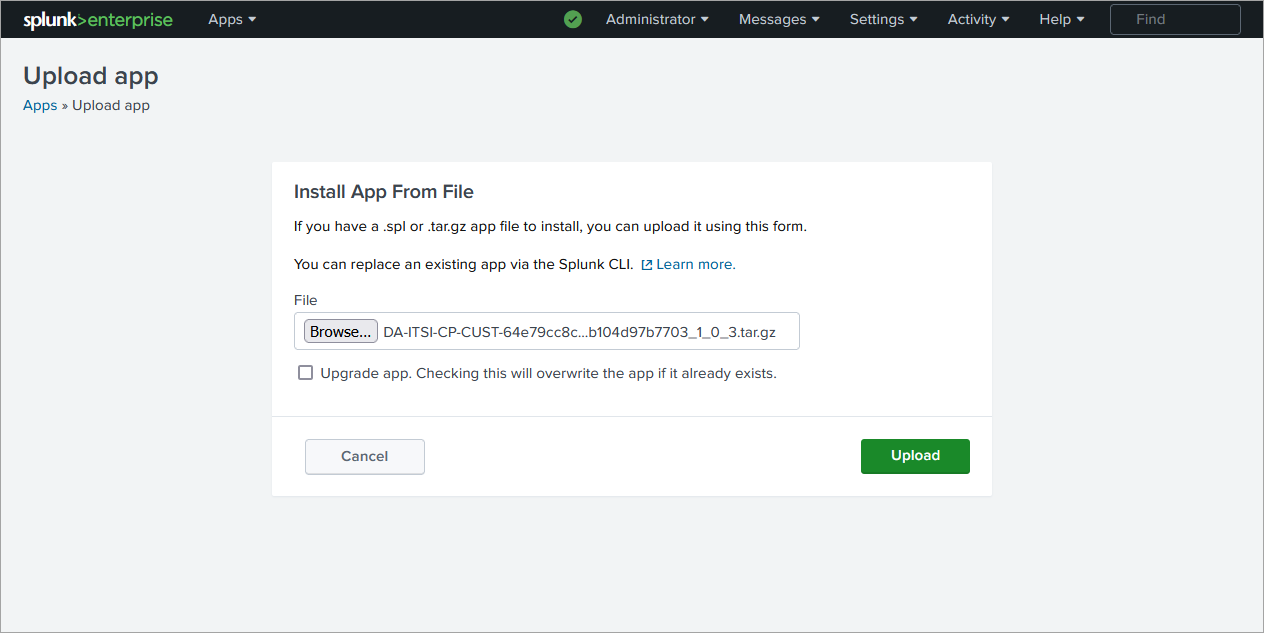
From the Splunk Web home screen, click the gear icon next to Apps
-
Click Install app from file
Install the Content Pack in a distributed Splunk Enterprise deployment
The Content Pack should be installed both on indexers and searchheads.
To install Content Pack in a distributed Splunk Enterprise deployment, follow these instructions:
https://docs.splunk.com/Documentation/AddOns/released/Overview/Distributedinstall
Install the Content Pack in Splunk Cloud Platform
To install Conetent Pack in Splunk Cloud Platform, follow these instructions:
https://docs.splunk.com/Documentation/AddOns/released/Overview/SplunkCloudinstall
2. Set up input from NFO
To configure Splunk inputs, follow these instructions: Configure Splunk Inputs
The preference is to use metrics based index as it is faster and enables the usage on analytics.
3. Configure the used macros referencing the indexes
- If you are using events based index and it is not flowintegrator:
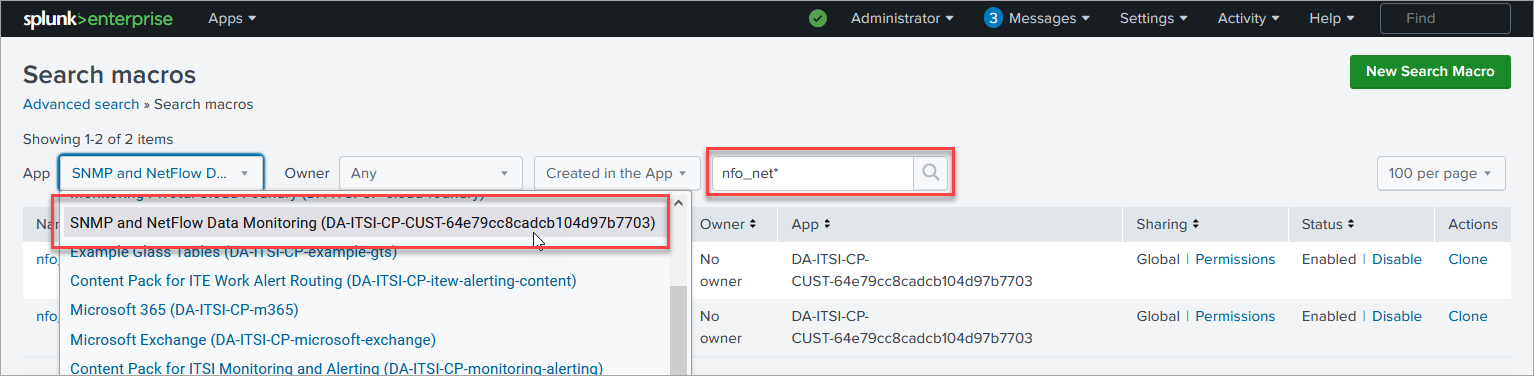
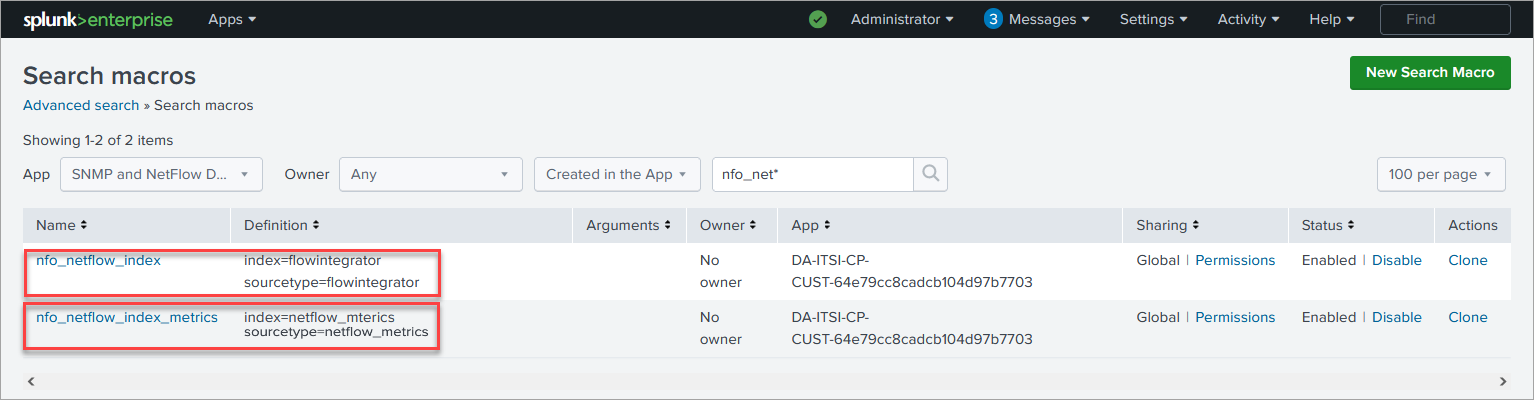
In Settings->Advanced search->Search macros find
nfo_netflow_indexmacro and change it to point to your events index - If you are using metrics based index and it is not netflow_metrics:
In Settings->Advanced search->Search macros find
nfo_netflow_index_metricsmacro and change it to point to your metrics index
If netflow_syslog_metrics sourcetype was used, please change also the sourcetype in the [netflow_index] macro.
4. Import Network Devices as Entities
In ITEW app go to Configuration>Entity Management and select Entity Discovery Searches tab. In the App dropdown select SNMP and NetFlow Data Monitoring app.
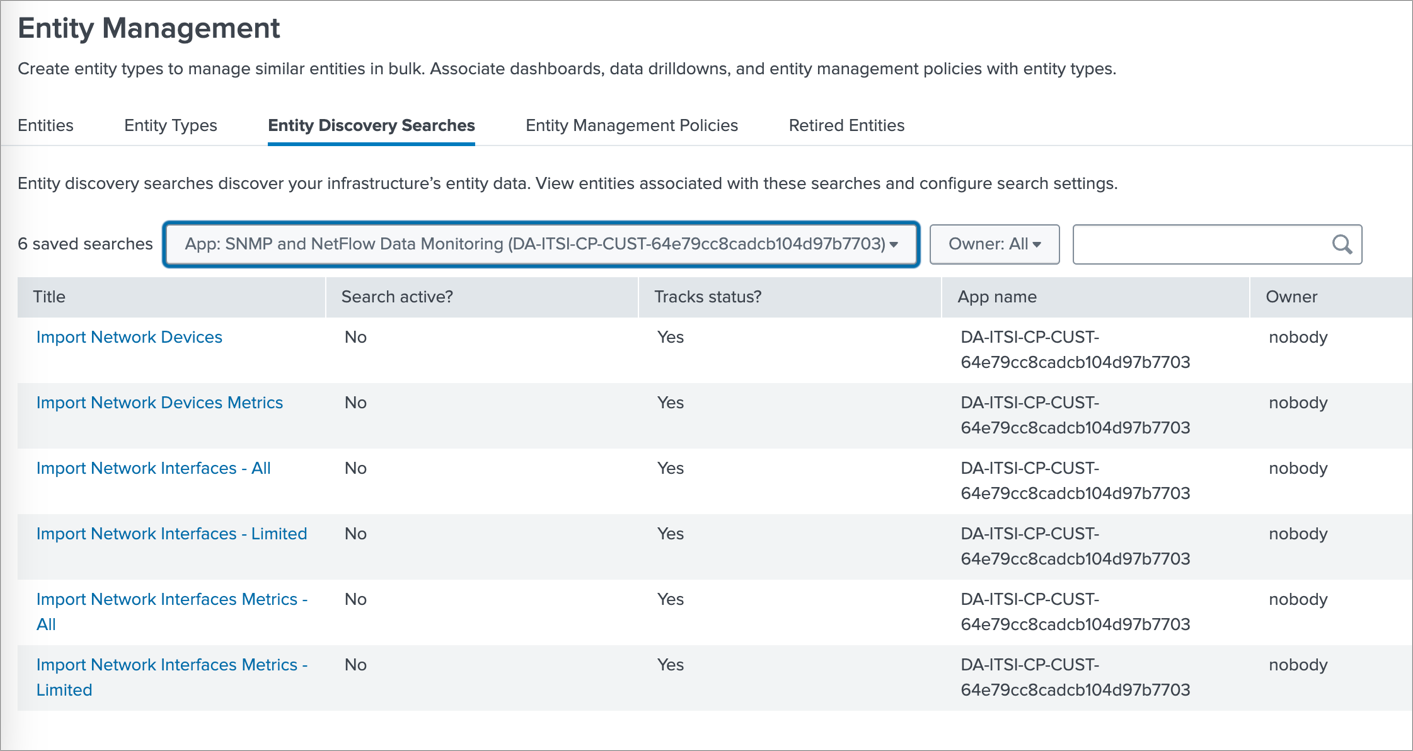
If SNMP data reported by SNMP Custom OID Sets Monitor (nfc_id=20103) is stored in an events based index then click on Import Network Devices, and if it is stored in metrics based index then click on Import Network Devices Metrics.
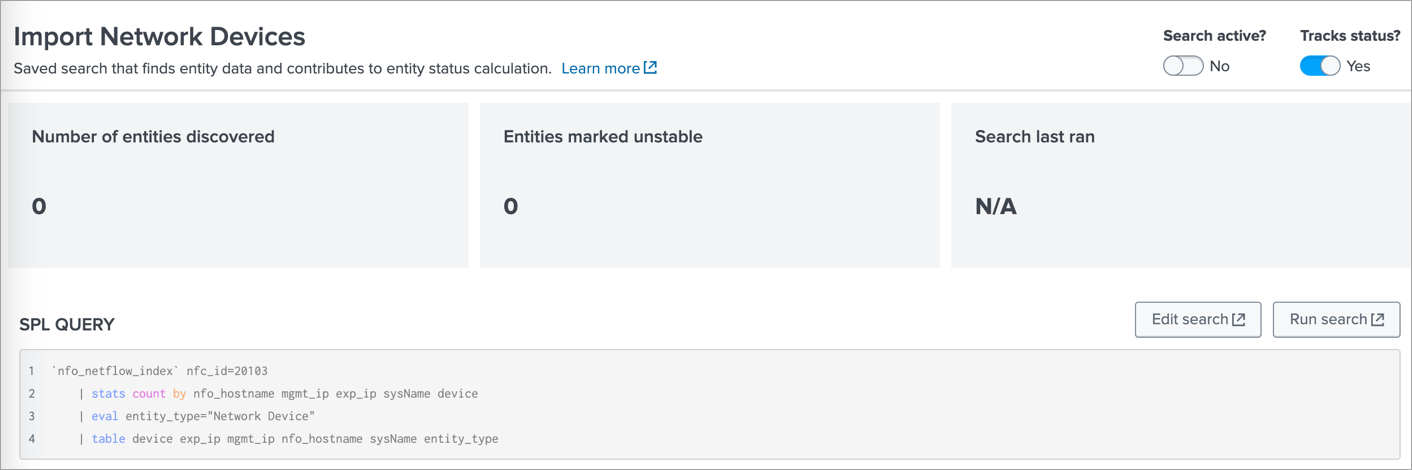
There change the Search active? toggle switch to Yes. This will import the discovered Devices as Entities.
5. Import Network Interfaces as Entities
In ITEW app go to Configuration>Entity Management and select Entity Discovery Searches tab. In the App dropdown select SNMP and NetFlow Data Monitoring app.
There are several options to import Network Interface entities:
- Import Network Interfaces – All
Select this if SNMP data reported by SNMP Custom OID Sets Monitor (nfc_id=20103) is stored in an events based index and you intend to import all detected interfaces. This is not recommended if the number of interfaces is huge, in that case use the next one – Import Network Interfaces – Limited
- Import Network Interfaces – Limited
Select this if SNMP data reported by SNMP Custom OID Sets Monitor (nfc_id=20103) is stored in an events based index and you intend to import a selected subset of interfaces. This search applies the critical_interfaces_lookup, where you can specify the list of interfaces to monitor.
Here is an example of critical_interfaces.csv lookup file:
nfo_hostname,"management_ip","snmp_index","comment"
localhost","10.0.3.2",1,"Important interface"
localhost",10.0.5.22,116,"Uplink"
Where:
- nfo_hostname: is the name of NFO host
- management_ip: is the SNMP polling IP address of the device
- snmp_index: is the index of the interface (received from SNMP polling)
- comment: internal comment
- Import Network Interfaces Metrics – All
Select this if SNMP data reported by SNMP Custom OID Sets Monitor (nfc_id=20103) is stored in a metrics based index and you intend to import all detected interfaces. This is not recommended if the number of interfaces is huge, in that case use the next one – Import Network Interfaces Metrics – Limited
- Import Network Interfaces Metrics – Limited
Select this if SNMP data reported by SNMP Custom OID Sets Monitor (nfc_id=20103) is stored in a metrics based index and you intend to import a selected subset of interfaces. This search applies the critical_interfaces_lookup, where you can specify the list of interfaces to monitor.
Here is an example of critical_interfaces.csv lookup file:
nfo_hostname,"management_ip","snmp_index","comment"
localhost","10.0.3.2",1,"Important interface"
localhost",10.0.5.22,116,"Uplink"
Where:
- nfo_hostname: is the name of NFO host
- management_ip: is the SNMP polling IP address of the device
- snmp_index: is the index of the interface (received from SNMP polling)
- comment: internal comment
6. Adding Entity Types
In IT Essentials Work app Configuration->Entity Management select the Entity Types tab
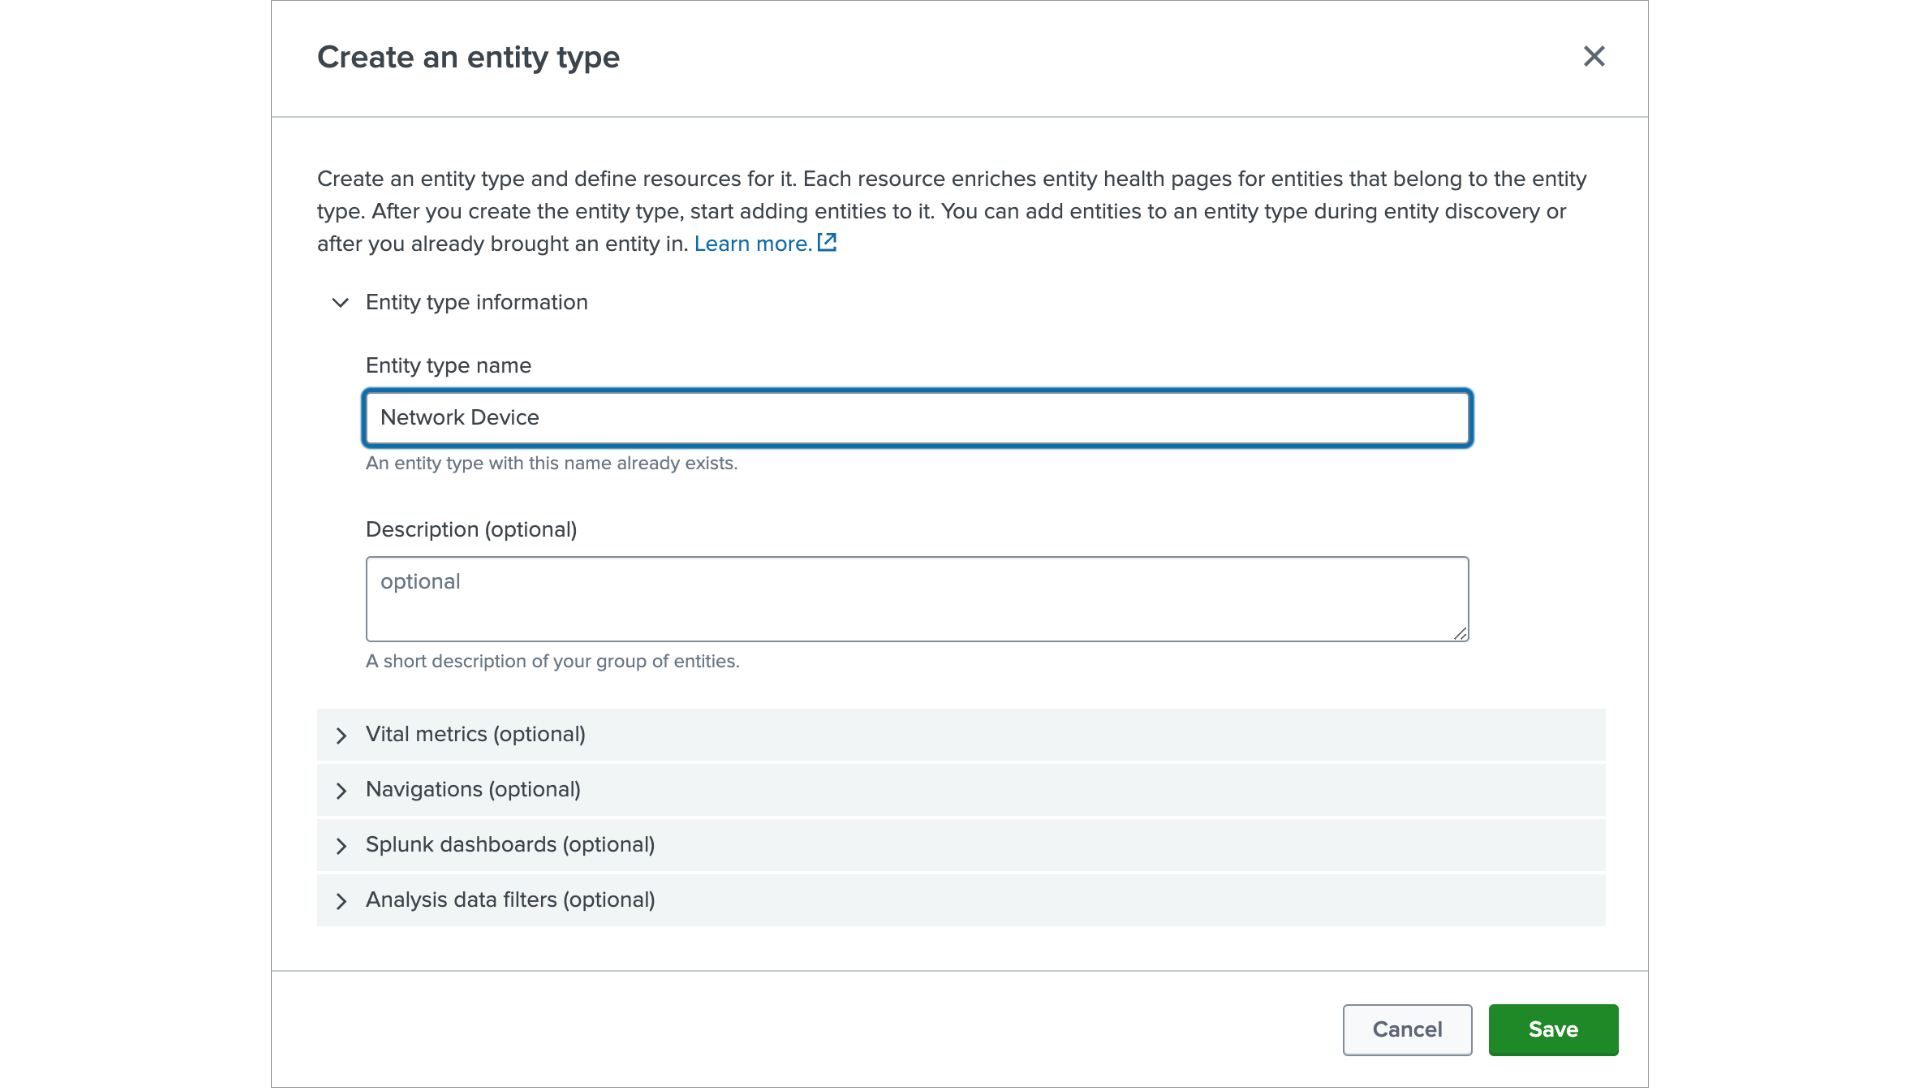
Adding “Network Device” Entity Type
- Click on Create Entity Type button. In the show form in the Entity type name field enter “Network Device”
- In the Vital Metrics section click on Add a Metric
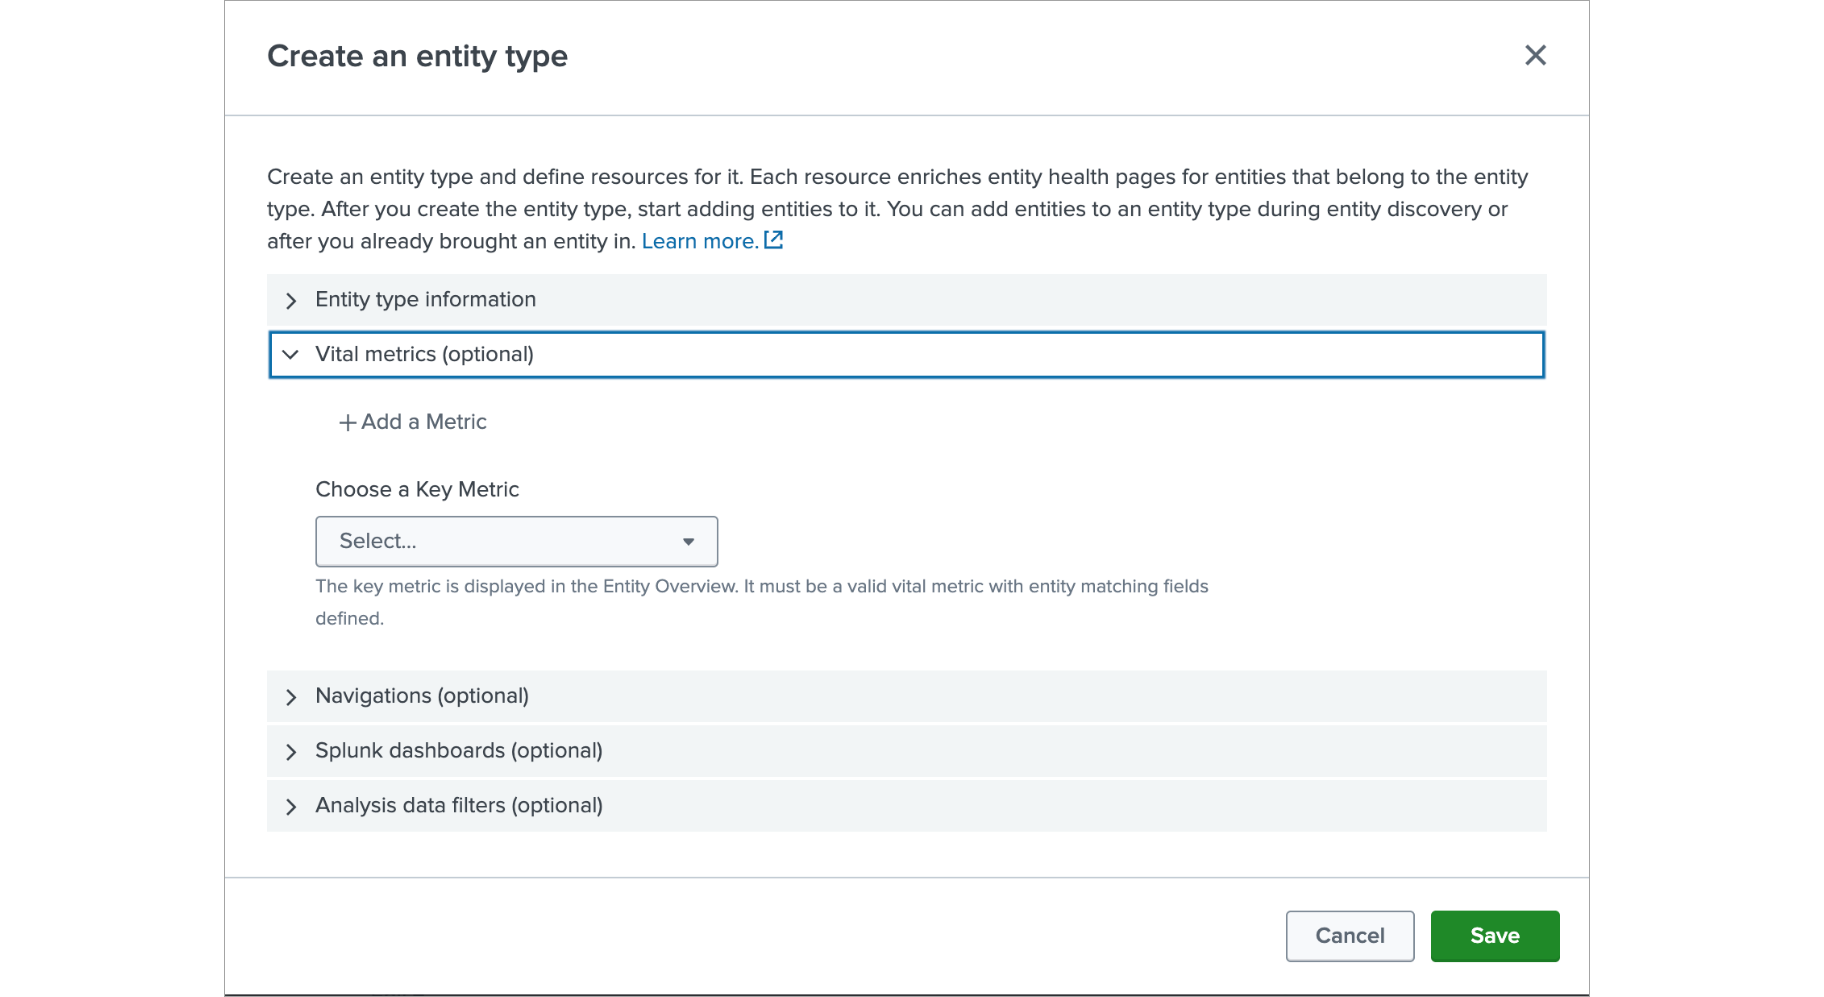
Enter “CPULoad” as the name, click save on the right side and expand the band by clicking on it.
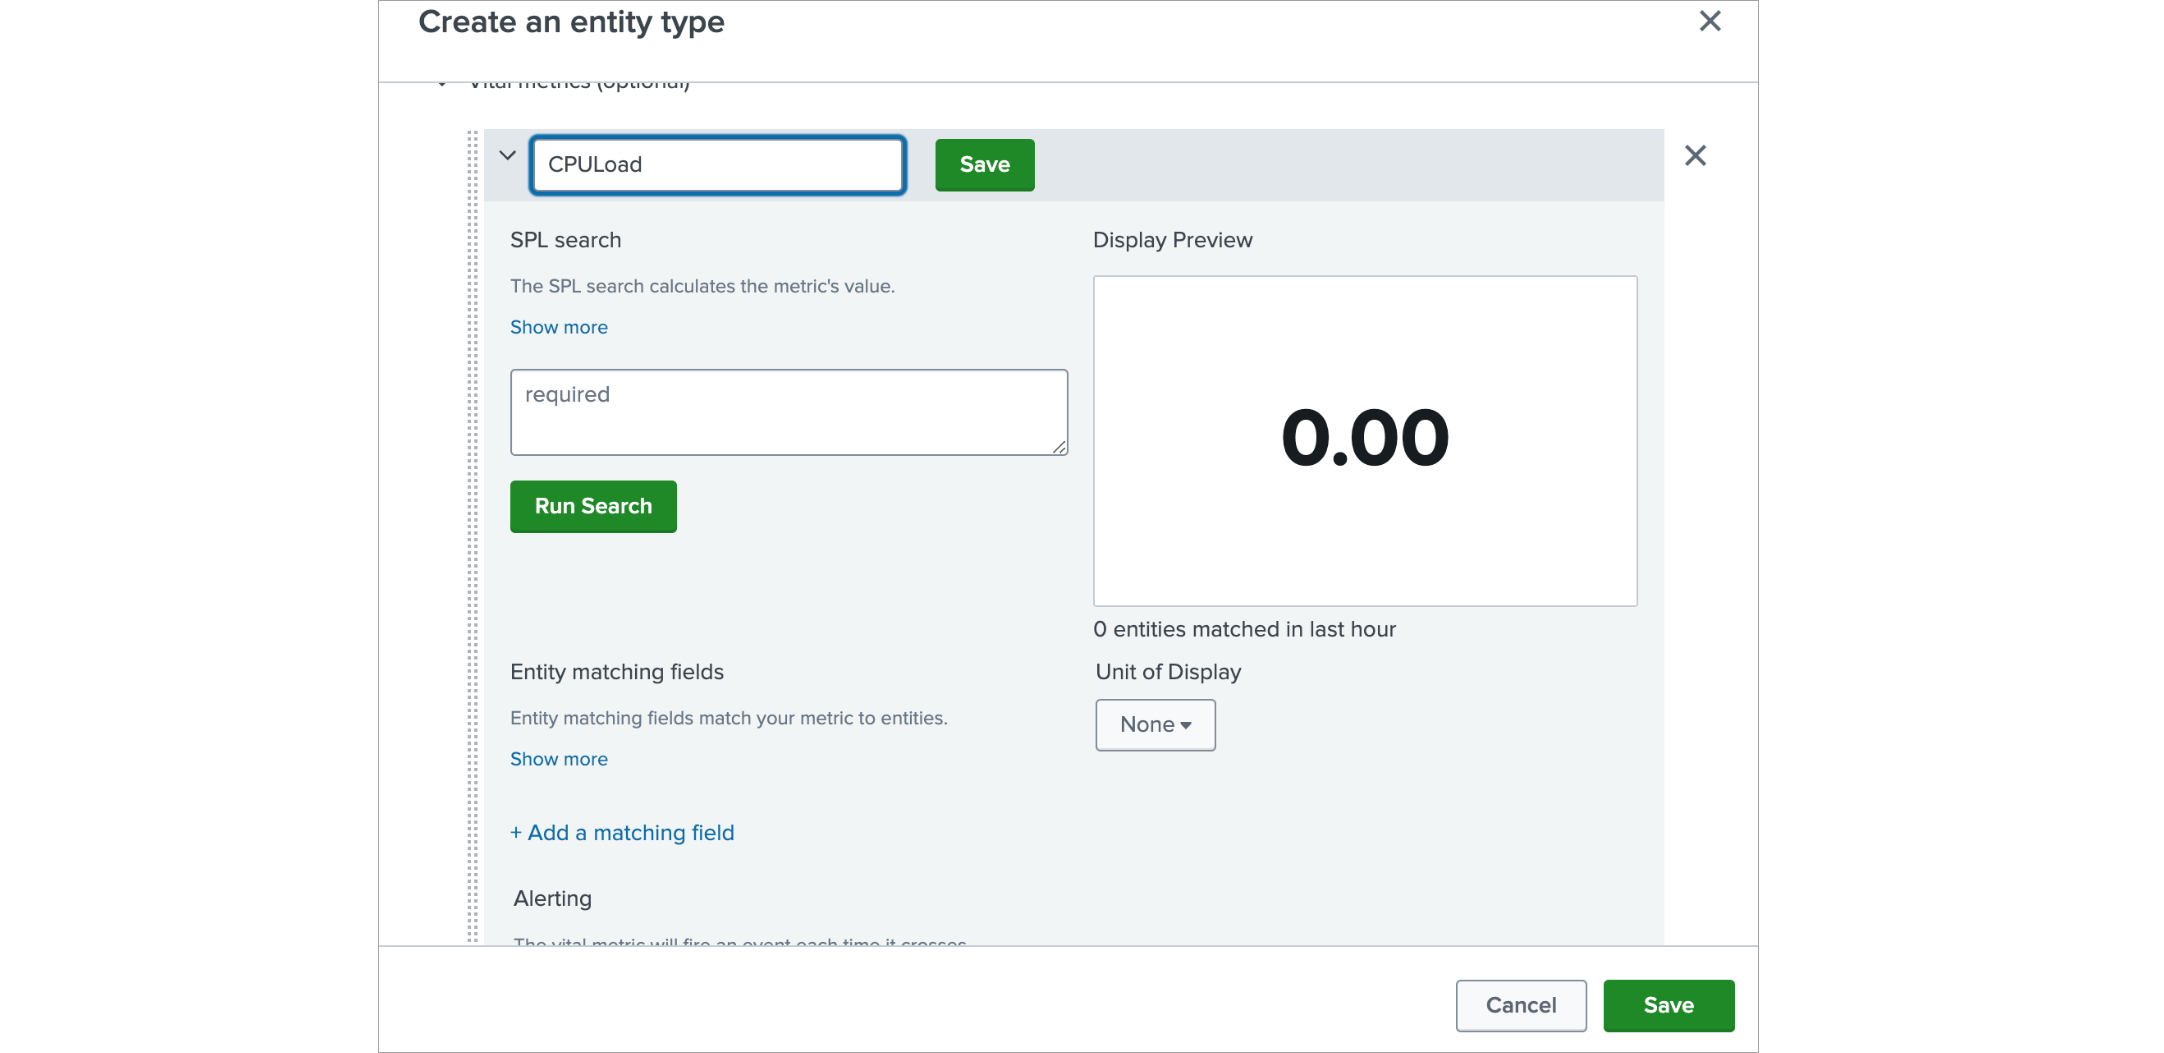
In the search enter in case of metrics index:
| mstats avg(cpu_load_percent) as cpu_load_percent WHERE  `nfo_netflow_index_metrics` nfc_id=20103 BY  device span=30s
| eval val=cpu_load_percent
| table _time val cpu_load_percent device
Or in case of event based index:
search `nfo_netflow_index` nfc_id=20103 cpu_load_percent=* device=*
| eval val=cpu_load_percent
| table _time val cpu_load_percent device
Click on Run Search button
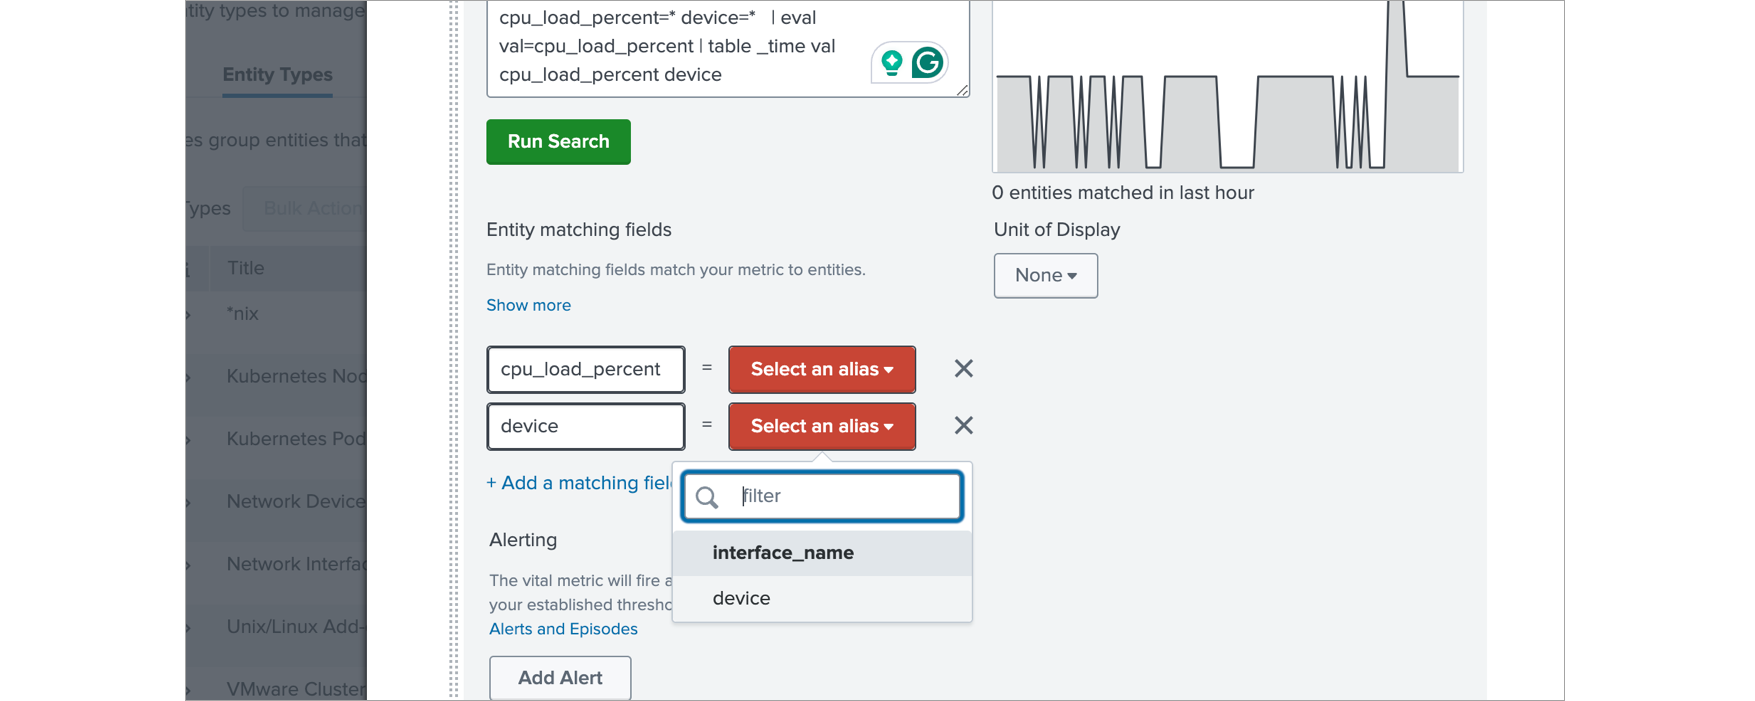
In the Entity matching fields delete cpu_load_percent row and in device row select device on right side.

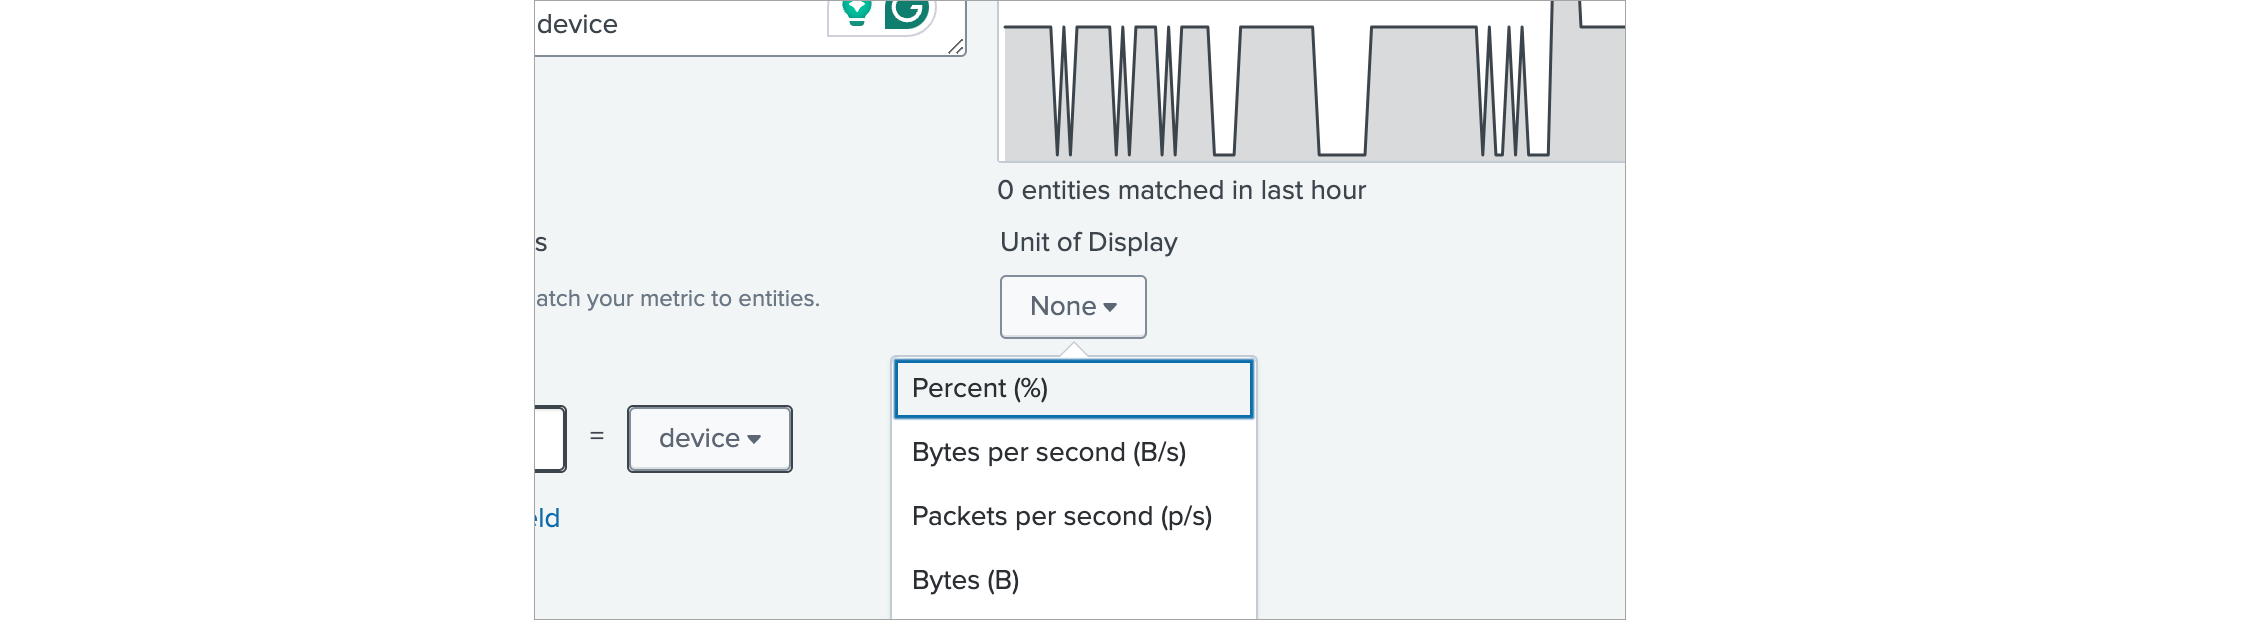
In Unit of Display select Percent
- In the Vital Metrics section click on Add a Metric
Enter “MemUsage” as the name, click save on the right side and expand the band by clicking on it.
In the search enter in case of metrics index:
| mstats avg(mem_used) as mem_used avg(mem_free) as mem_free avg(mem_total) as mem_total avg(mem_used_percent) as mem_used_percent  WHERE  `nfo_netflow_index_metrics` nfc_id=20103 BY  device span=30s
| fillnull value=NULL mem_free mem_used mem_total mem_used_percent
| eval mem_free=if(mem_free=="NULL",mem_total-mem_used,mem_free)
| eval mem_used=if(mem_used=="NULL",mem_total-mem_free,mem_used)
| eval mem_total=if(mem_total=="NULL",mem_used+mem_free,mem_total)
| eval mem_used_percent=if(mem_used_percent=="NULL",100*mem_used/mem_total,mem_used_percent)
| eval val = mem_used_percent
| table _time val mem_used_percent device
Or in case of event based index:
search `nfo_netflow_index` nfc_id=20103 mem_used=* device=*
| fillnull value=NULL mem_free mem_used mem_total mem_used_percent
| eval mem_free=if(mem_free=="NULL",mem_total-mem_used,mem_free)
| eval mem_used=if(mem_used=="NULL",mem_total-mem_free,mem_used)
| eval mem_total=if(mem_total=="NULL",mem_used+mem_free,mem_total)
| eval mem_used_percent=if(mem_used_percent=="NULL",100*mem_used/mem_total,mem_used_percent)
| eval val=mem_used_percent
| table _time val mem_used_percent device
Click on Run Search button
- Choose Key Metric
In the Entity matching fields delete all rows except device, and in device row select device on right side.
In Unit of Display select Percent
Choose a Key Metric

Select CPULoad
After that click Save.
- Optional: if metrics index is used then Analytics can be configured
Click on Analysis data filters band
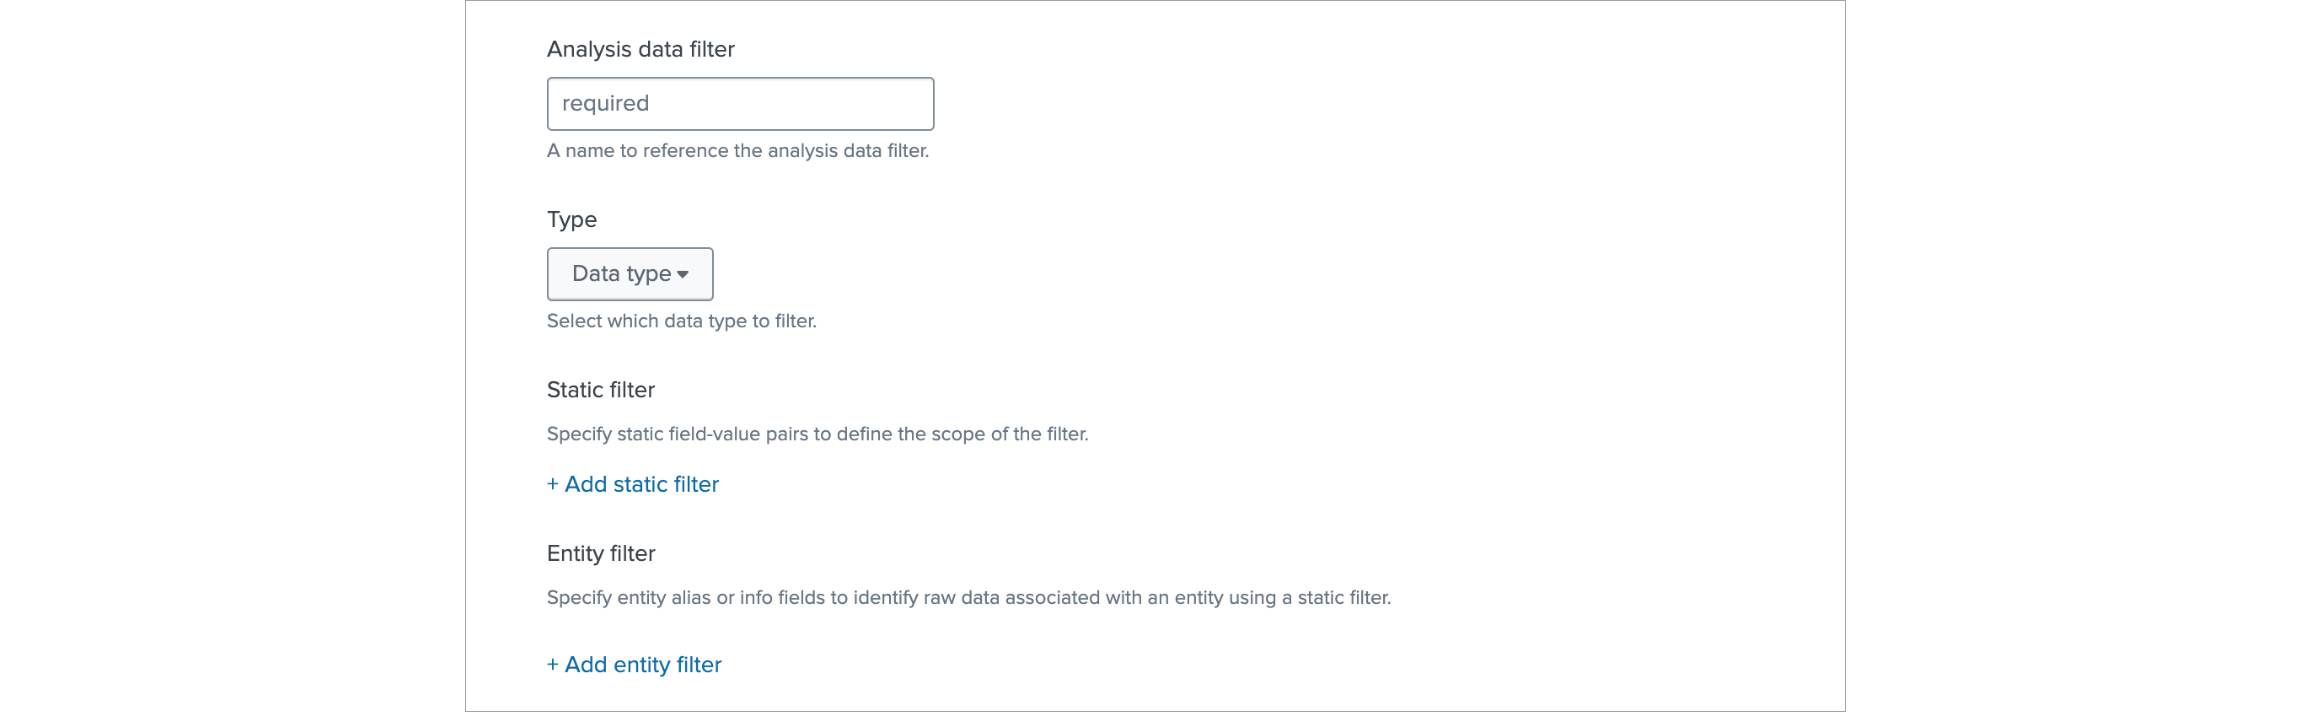
In Analysis data filter click on Add filter group button, in the resulting form:
- enter a name for it
- in the Type drop down select Metrics
- add two static filters with these key value pairs:
index:
netflow_metricsnfc_id:20103 - add an Entity filter and set it up as
device:
device
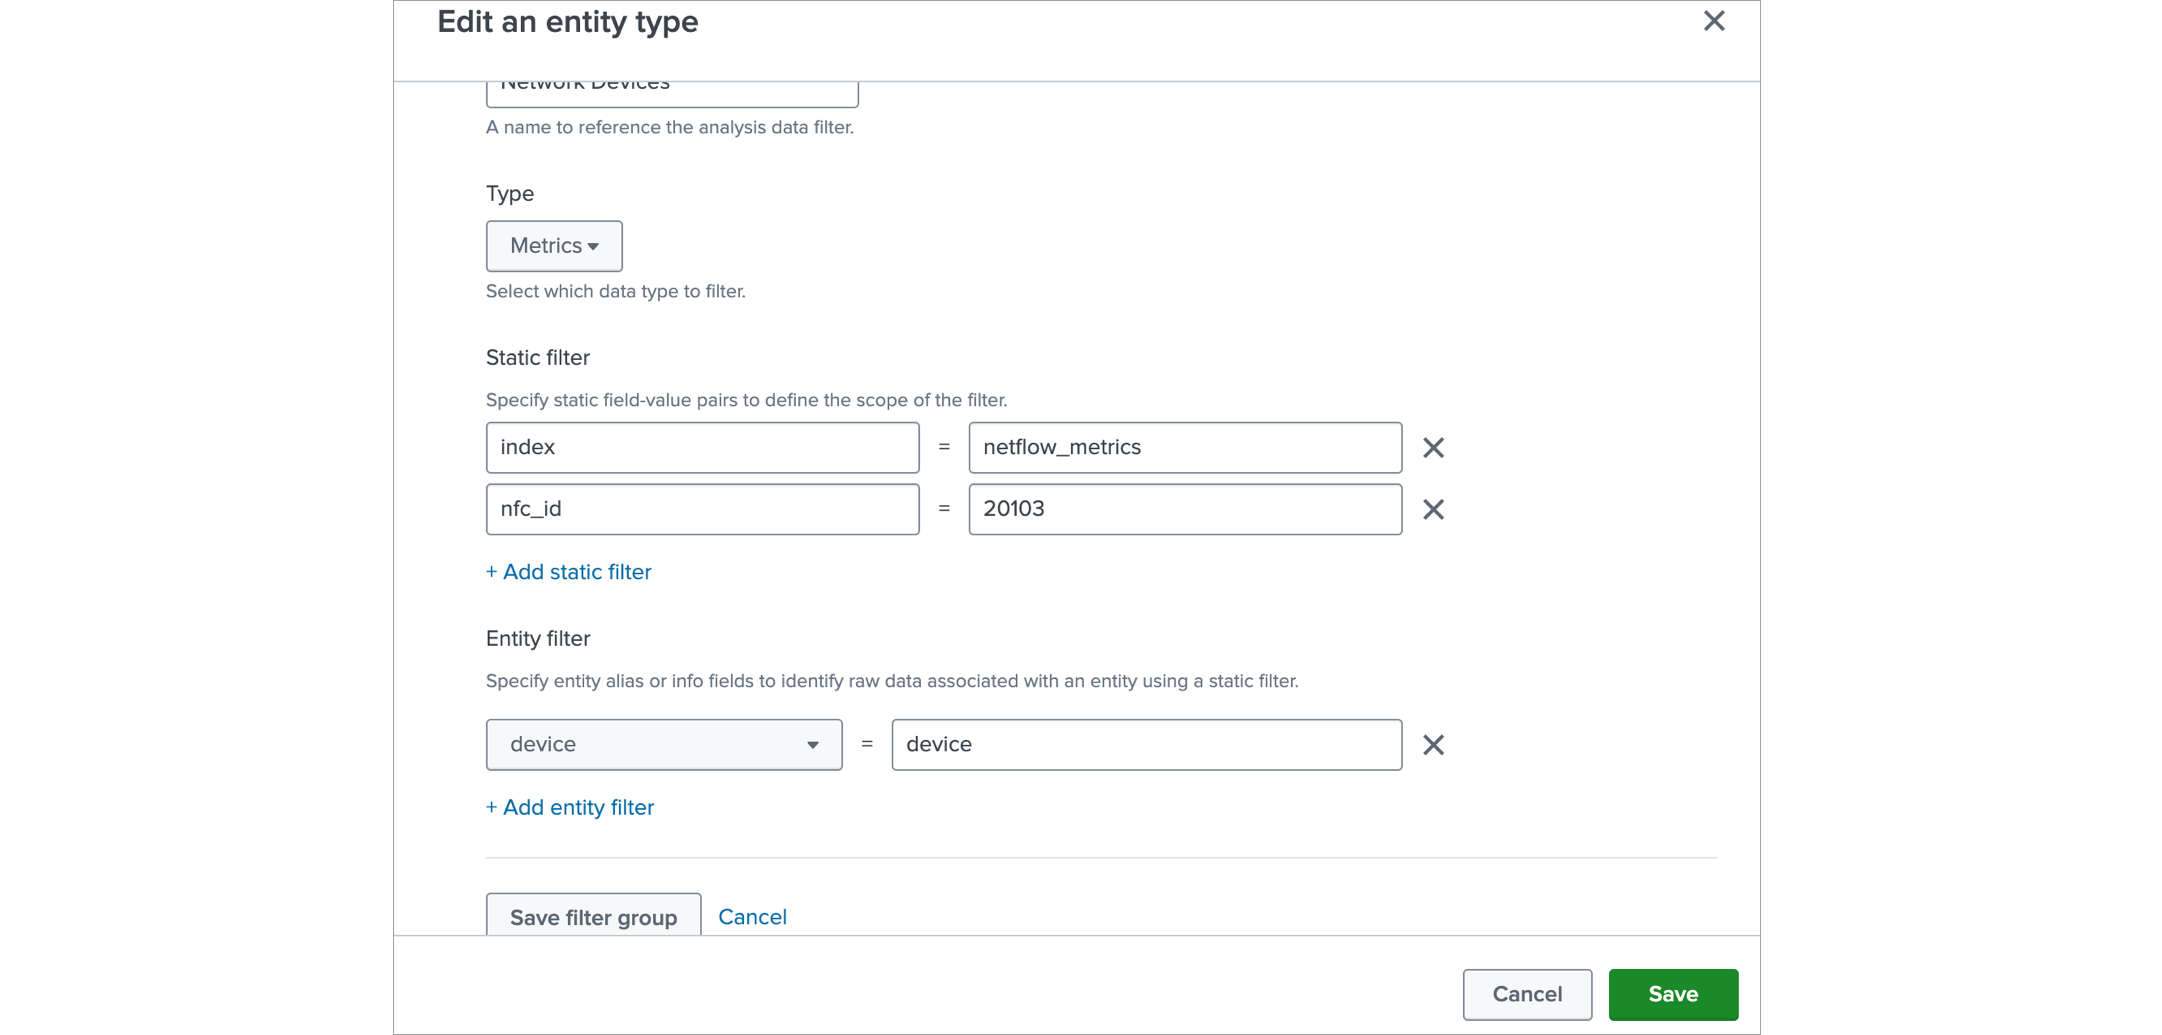
Click Save filter group and then Save.
- Optional: if SNMP trap events are sent to an event based index then they can be made visible in Analytics
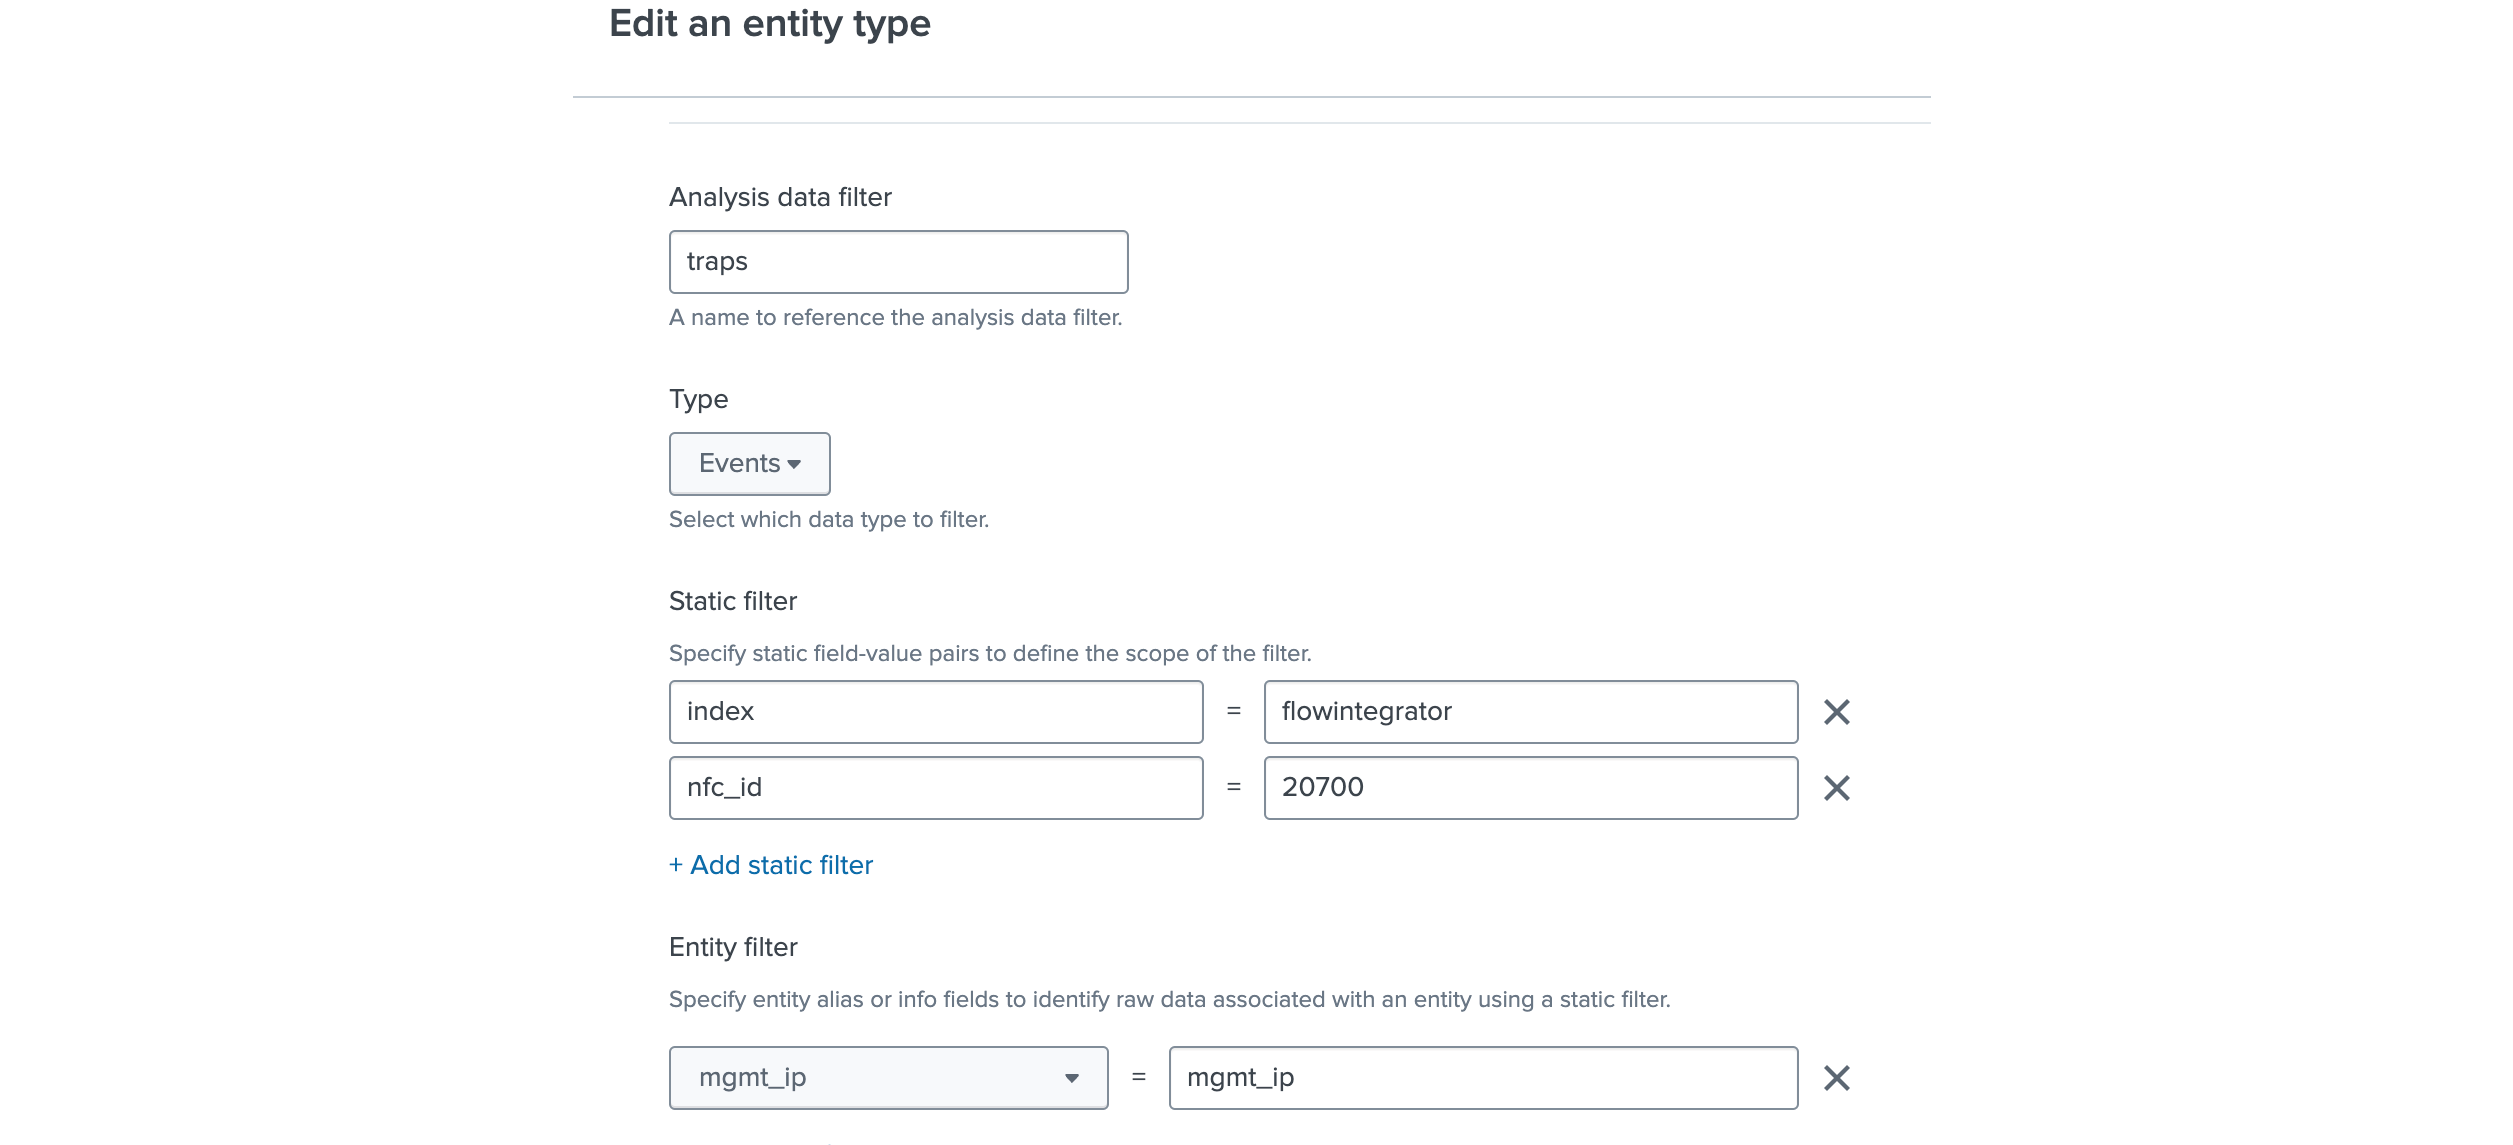
Click on Analysis data filters band
In Analysis data filter click on Add filter group button, in the resulting form:
- enter a name for it, for example
SNMP traps - in the Type drop down select Events
- add two static filters with these key value pairs (for the index use the index where the SNMP trap events are stored):
index:
flowintegratornfc_id:20700 - add an Entity filter and set it up as
mgmt_ip:
mgmt_ip
Click Save filter group and then Save.
Adding “Network Interface” Entity Type
-
Click on Create Entity Type button. In the show form in the Entity type name field enter “Network Interface”
-
In the Vital Metrics section click on Add a Metric
Enter “PercentLost” as the name, click save on the right side and expand the band by clicking on it.
In the search enter in case of metrics index:
| mstats max(ifInErrors) as maxIfInErrors min(ifInErrors) as minIfInErrors
                max(ifOutErrors) as maxIfOutErrors min(ifOutErrors) as minIfOutErrors
                max(ifInDiscards) as maxIfInDiscards min(ifInDiscards) as minIfInDiscards
                max(ifOutDiscards) as maxIfOutDiscards  min(ifOutDiscards) as minIfOutDiscards
                max(ifInUcastPkts) as maxifInUcastPkts  min(ifInUcastPkts) as minifInUcastPkts
                max(ifOutUcastPkts) as maxifOutUcastPkts  min(ifOutUcastPkts) as minifOutUcastPkts
                max(ifInNUcastPkts) as maxifInNUcastPkts  min(ifInNUcastPkts) as minifInNUcastPkts
                max(ifOutNUcastPkts) as maxifOutNUcastPkts  min(ifOutNUcastPkts) as minifOutNUcastPkts
                WHERE `nfo_netflow_index_metrics` nfc_id=20103 oid_set=interface_mon
                BY interface_name span=1h
     | eval IfInErrorsChange = maxIfInErrors-minIfInErrors
     | eval IfOutErrorsChange = maxIfOutErrors-minIfOutErrors
     | eval IfInDiscardsChange = maxIfInDiscards-minIfInDiscards
     | eval IfOutDiscardsChange = maxIfOutDiscards-minIfOutDiscards
     | eval ifInUcastPktsChange = maxifInUcastPkts-minifInUcastPkts
     | eval ifOutUcastPktsChange = maxifOutUcastPkts-minifOutUcastPkts
     | eval ifInNUcastPktsChange = maxifInNUcastPkts-minifInNUcastPkts
     | eval ifOutNUcastPktsChange = maxifOutNUcastPkts-minifOutNUcastPkts
     | eval ifErrorsDiscardsChange = IfInErrorsChange+IfOutErrorsChange+IfInDiscardsChange+IfOutDiscardsChange
     | eval ifPktsChange = ifInUcastPktsChange+ifOutUcastPktsChange+ifInNUcastPktsChange+ifOutNUcastPktsChange+ifErrorsDiscardsChange
     | eval PercentLost = if(ifPktsChange>0,ifErrorsDiscardsChange/ifPktsChange*100,0)
    | eval val=PercentLost
    | table _time val interface_name PercentLost
Or in case of event based index:
search `nfo_netflow_index` nfc_id=20103  oid_set="interface_mon"
          | stats latest(ifInErrors) as maxIfInErrors earliest(ifInErrors) as minIfInErrors
             latest(ifOutErrors) as maxIfOutErrors earliest(ifOutErrors) as minIfOutErrors
             latest(ifInDiscards) as maxIfInDiscards earliest(ifInDiscards) as minIfInDiscards
             latest(ifOutDiscards) as maxIfOutDiscards  earliest(ifOutDiscards) as minIfOutDiscards
             latest(ifInUcastPkts) as maxifInUcastPkts  earliest(ifInUcastPkts) as minifInUcastPkts
             latest(ifOutUcastPkts) as maxifOutUcastPkts  earliest(ifOutUcastPkts) as minifOutUcastPkts
             latest(ifInNUcastPkts) as maxifInNUcastPkts  earliest(ifInNUcastPkts) as minifInNUcastPkts
             latest(ifOutNUcastPkts) as maxifOutNUcastPkts  earliest(ifOutNUcastPkts) as minifOutNUcastPkts
             latest(_time) AS _time
                by interface_name
          | eval IfInErrorsChange = maxIfInErrors-minIfInErrors
          | eval IfOutErrorsChange = maxIfOutErrors-minIfOutErrors
          | eval IfInDiscardsChange = maxIfInDiscards-minIfInDiscards
          | eval IfOutDiscardsChange = maxIfOutDiscards-minIfOutDiscards
          | eval ifInUcastPktsChange = maxifInUcastPkts-minifInUcastPkts
          | eval ifOutUcastPktsChange = maxifOutUcastPkts-minifOutUcastPkts
          | eval ifInNUcastPktsChange = maxifInNUcastPkts-minifInNUcastPkts
          | eval ifOutNUcastPktsChange = maxifOutNUcastPkts-minifOutNUcastPkts
          | eval ifErrorsDiscardsChange = IfInErrorsChange+IfOutErrorsChange+IfInDiscardsChange+IfOutDiscardsChange
          | eval ifPktsChange = ifInUcastPktsChange+ifOutUcastPktsChange+ifInNUcastPktsChange+ifOutNUcastPktsChange+ifErrorsDiscardsChange
          | eval PercentLost = if(ifPktsChange>0,ifErrorsDiscardsChange/ifPktsChange*100,0)
          | sort - PercentLost
          | eval val=PercentLost
          | table _time val interface_name PercentLost
Click on Run Search button
In the Entity matching fields delete all rows except interface_name, and in interface_name row select interface_name on right side.
In Unit of Display select Percent
Choose a Key Metric by selecting PercentLost
After that click Save.
- Optional – if metrics index is used then Analytics can be configured
Click on Analysis data filters band
In Analysis data filter click on Add filter group button, in the resulting form:
- enter a name for it
- in the Type drop down select Metrics
- add two static filters with these key value pairs : index – netflow_metrics nfc_id – 20103
- add an Entity filter and set it up as Interface_name – interface_name
Click Save filter group and then Save.
Conclusion
The NetFlow Logic Content Pack empowers you to streamline network monitoring within Splunk IT Essentials Work (ITEW). By integrating seamlessly with ITEW, this Content Pack provides pre-built discovery searches for critical network entities:
- Network Devices: Gain automatic discovery and monitoring of network devices within your infrastructure.
- Network Interfaces: Monitor individual network interfaces for detailed traffic insights and potential performance bottlenecks.
These pre-built searches simplify the initial setup process, allowing you to focus on gaining valuable insights from your network data. The Content Pack leverages macros, transforms, and saved searches to streamline network data management within ITEW.
Additional Benefits
- Improved visibility into network health through real-time performance metrics.
- Proactive identification and troubleshooting of network issues.
- Enhanced network management capabilities within ITEW.
Overall, the NetFlow Logic Content Pack provides a valuable solution for enhancing network monitoring capabilities within Splunk ITEW.