Google Cloud Platform
⚠️ Deprecation Notice: These dashboards are part of the final release of this app and is now deprecated. Their functionality is now fully integrated into Network Conversations dashboards. To learn more about the NFO Module consolidation and EOL, visit https://docs.netflowlogic.com/next/nfo_user_guide/solutions-at-a-glance.
These dashboards are design to view network traffic reported by Google Cloud Platform (GCP) VPC Flow Logs.
GCP Traffic Overview
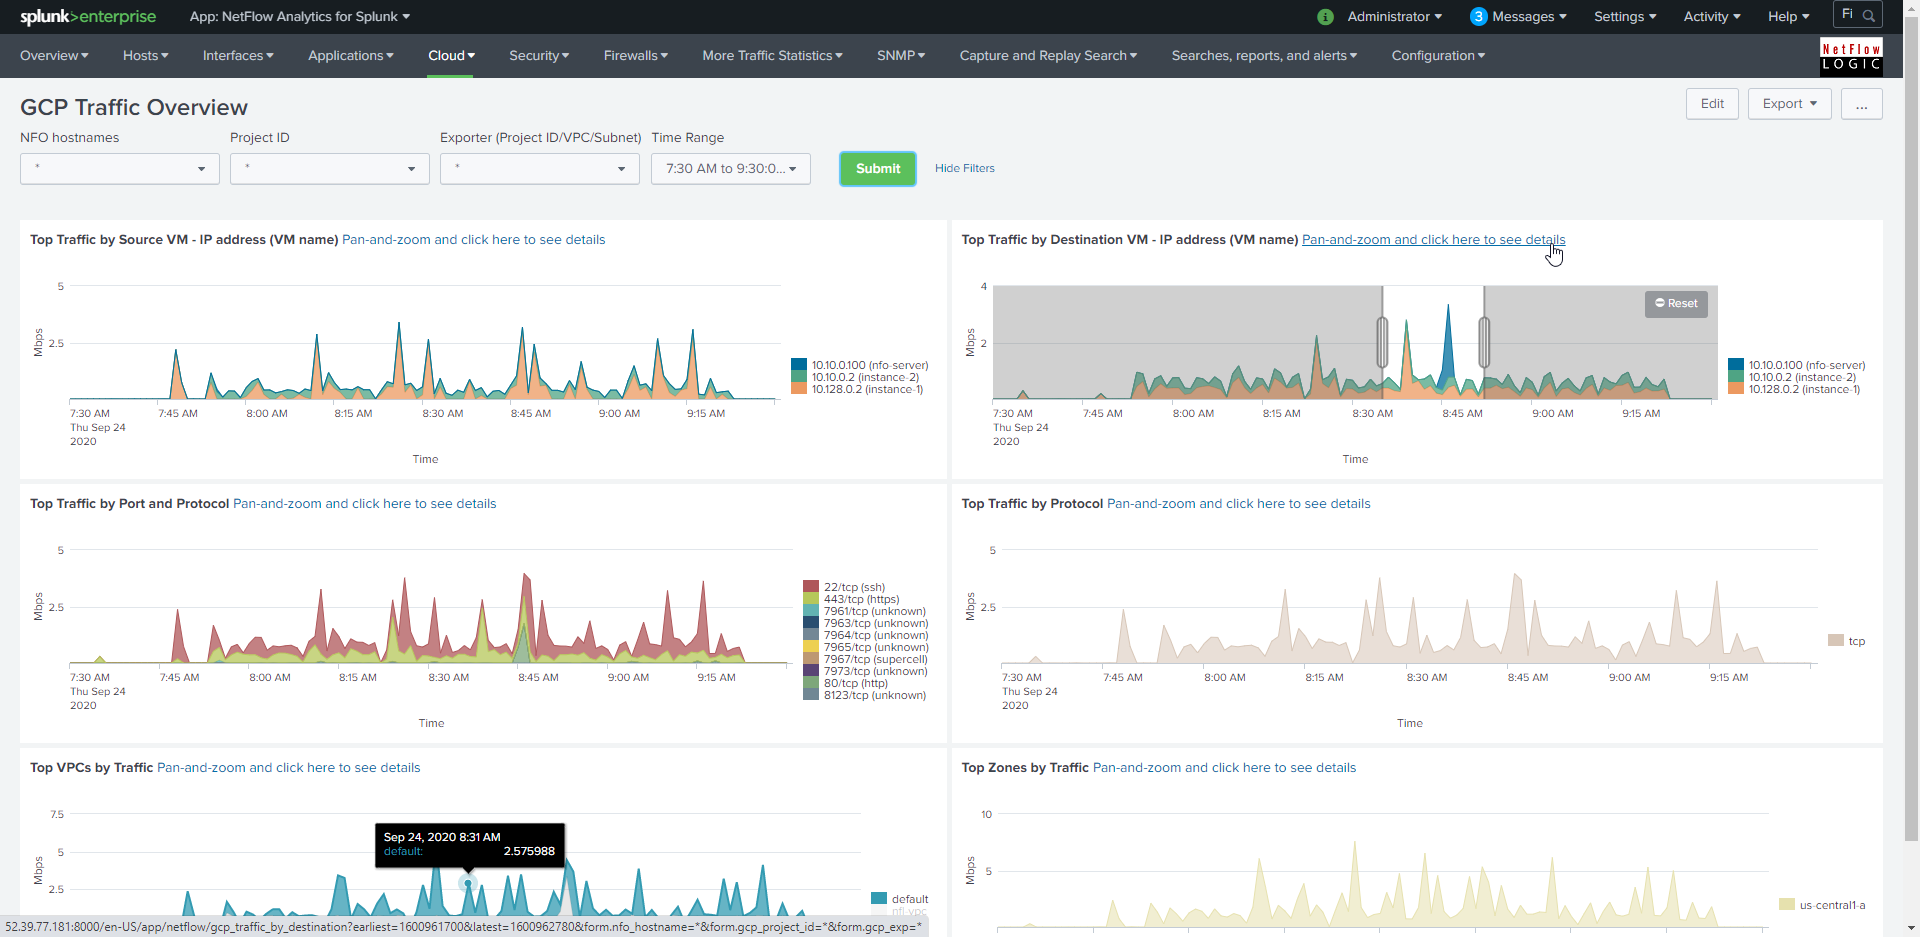
The GCP Traffic Overview dashboard is the top view, aimed to provide a summary on Google Cloud VPC traffic over a time period. The views can be filtered by the NFO Hostnames, Project ID, VPC/Subnet, and Time Range.
The panels show Top Traffic by Source VM, Top Traffic by Destination VM, Top Traffic by Protocol and Port, Top Traffic by Protocol, Top VPCs by Traffic, Top Zones by Traffic. You can pan-and-zoom to select a specific time range on the panel and drill-down to the appropriate dashboard to see more details and apply additional filters.
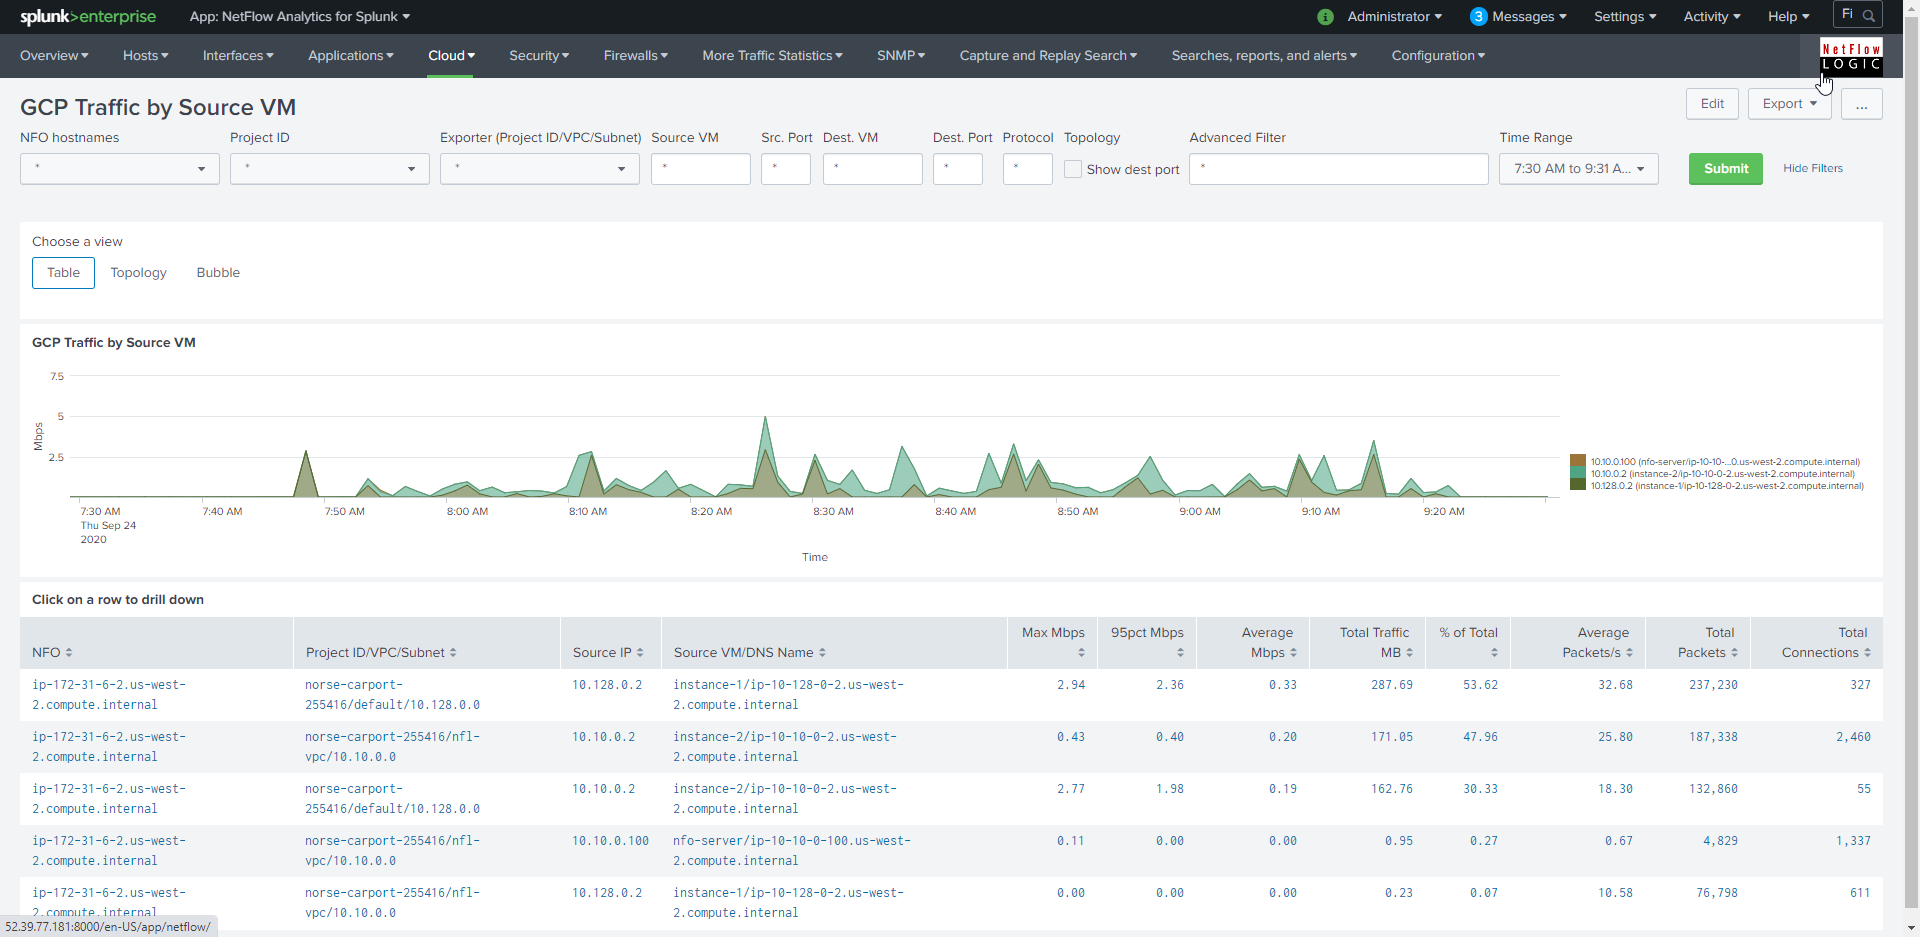
GCP Traffic by Source VM
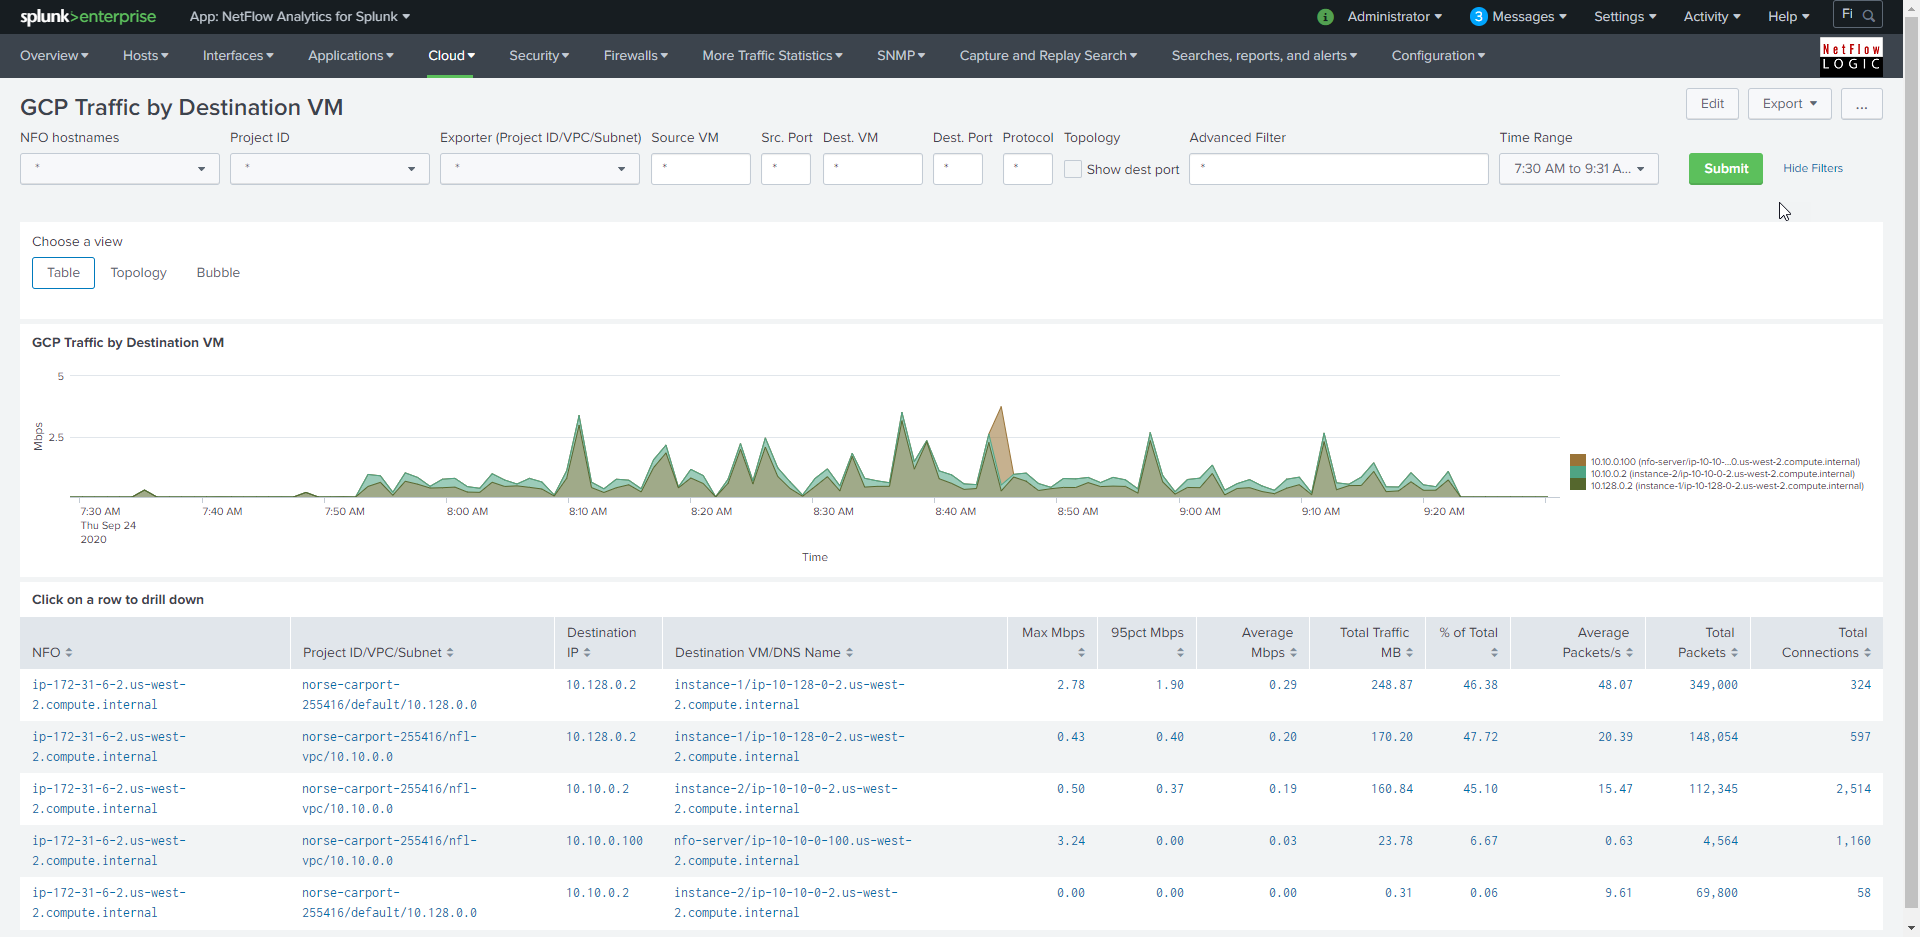
GCP Traffic by Destination VM
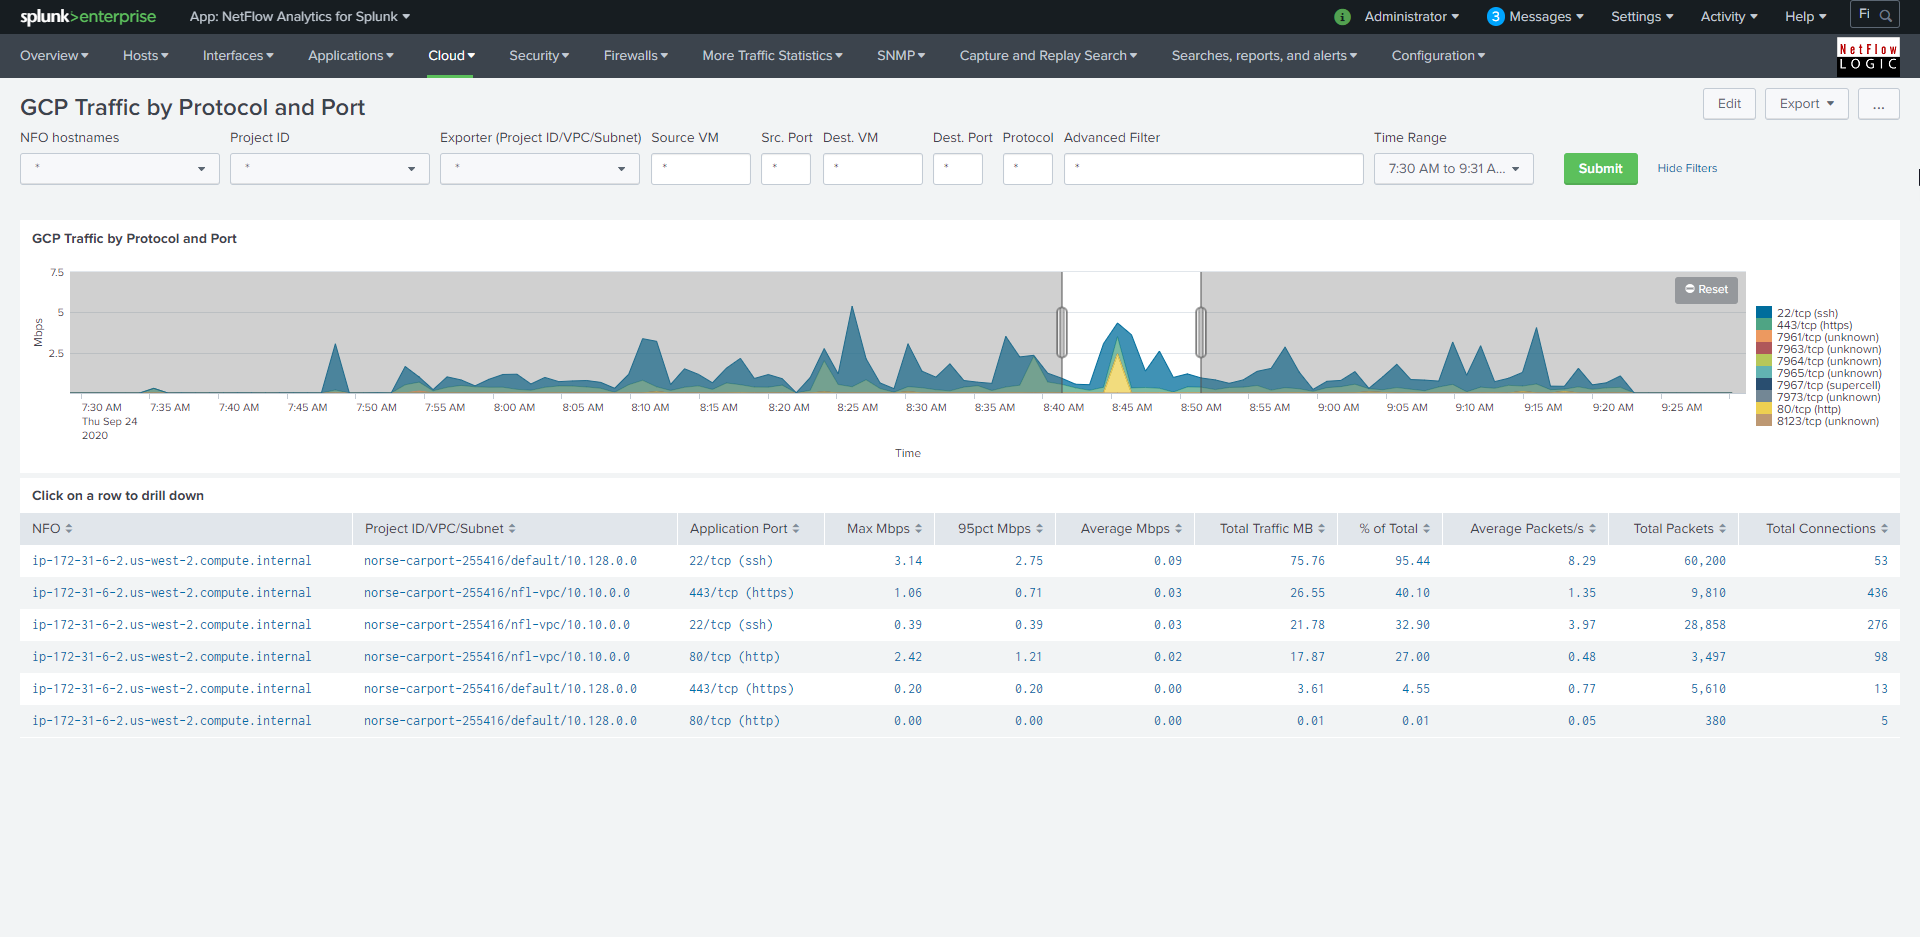
GCP Traffic by Protocol and Port
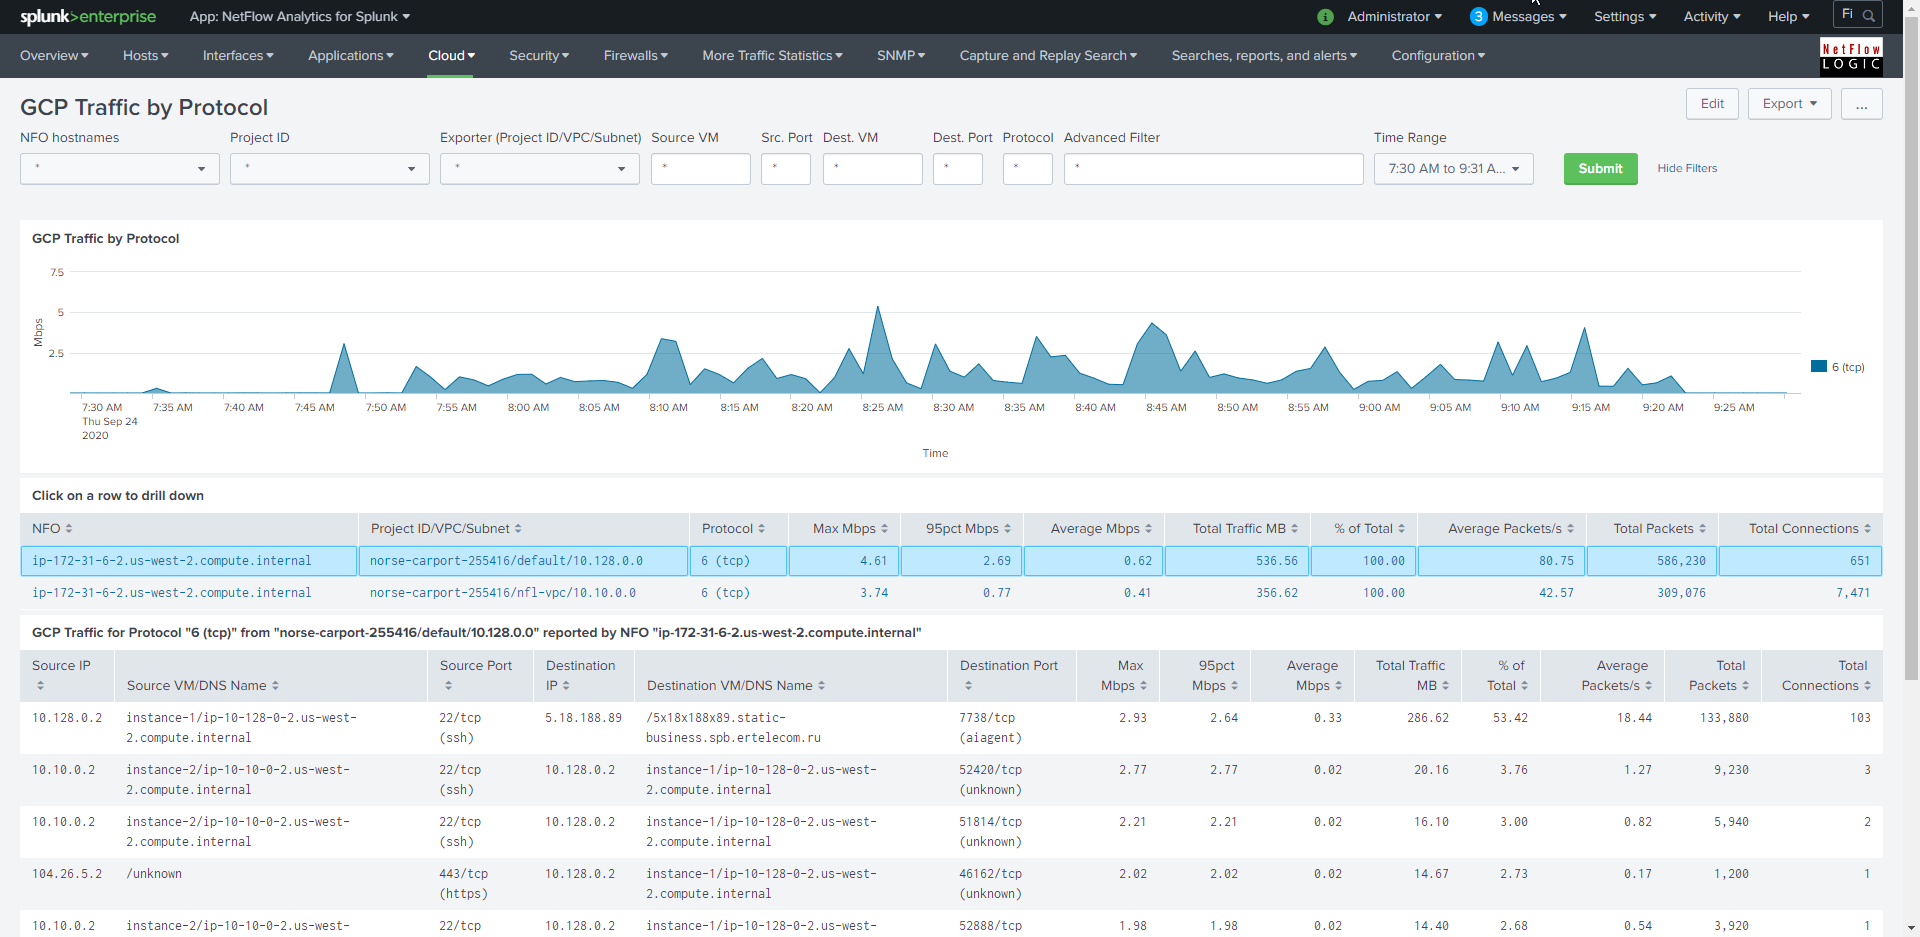
GCP Traffic by Protocol
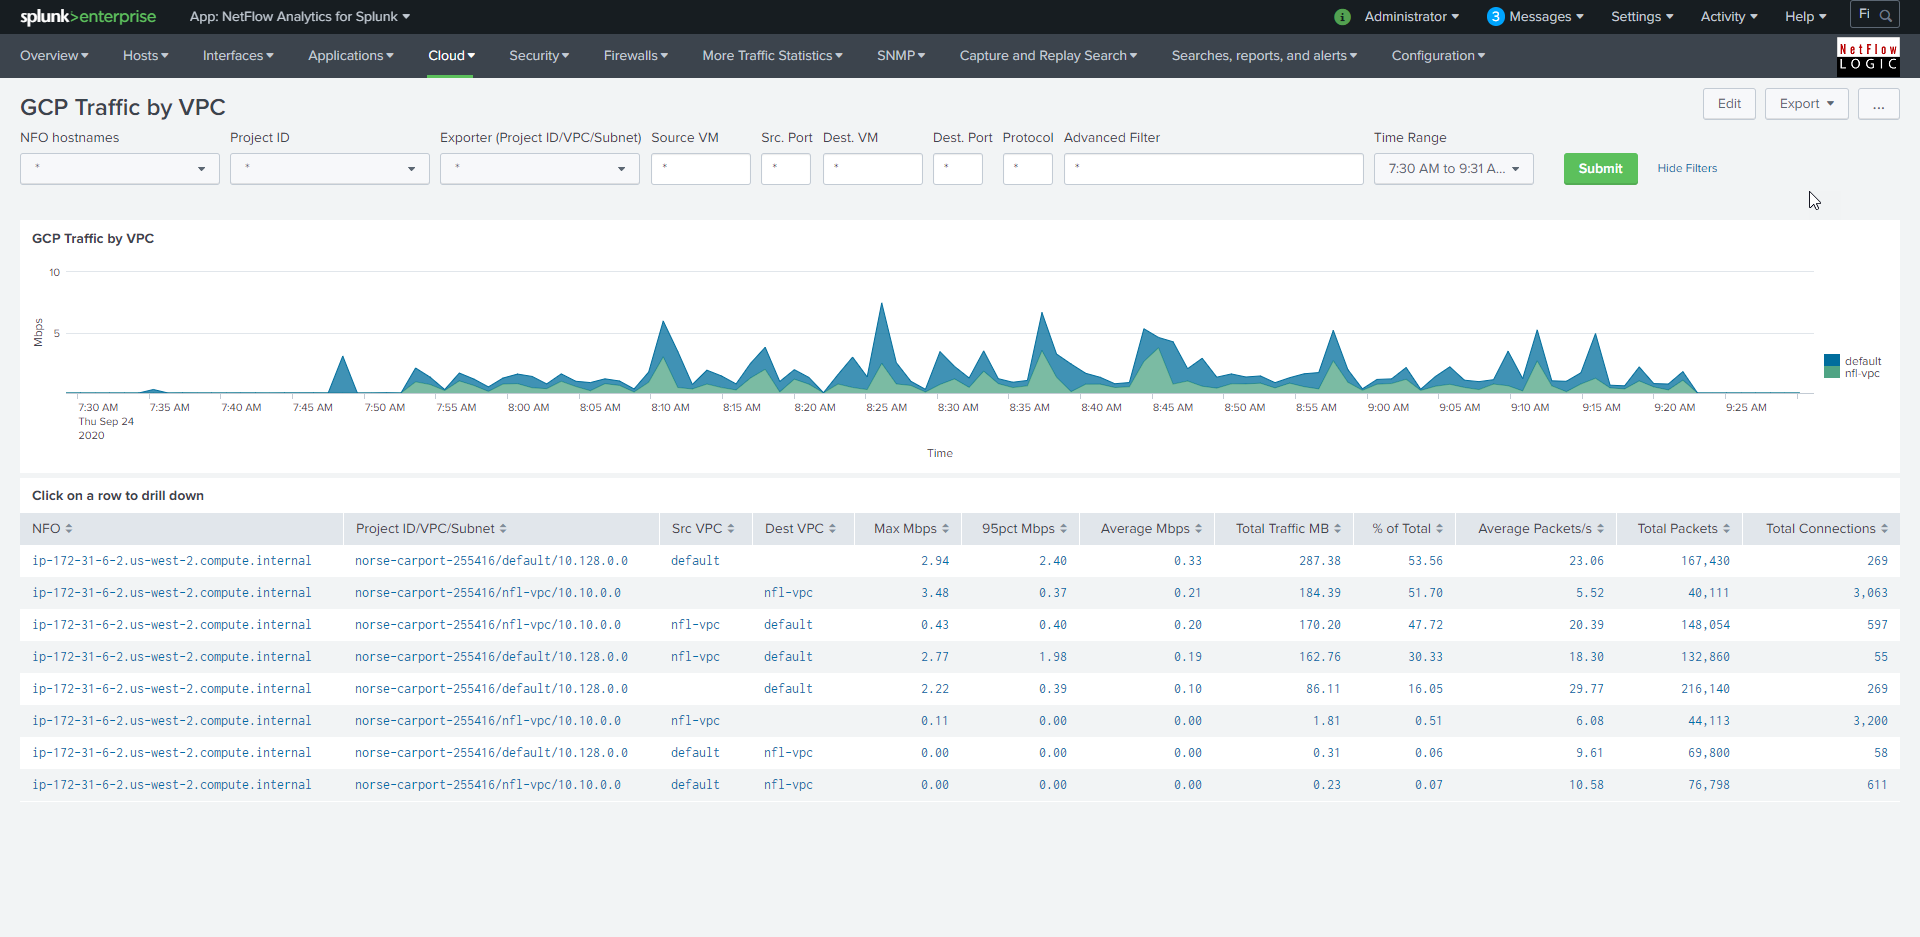
GCP Traffic by VPC
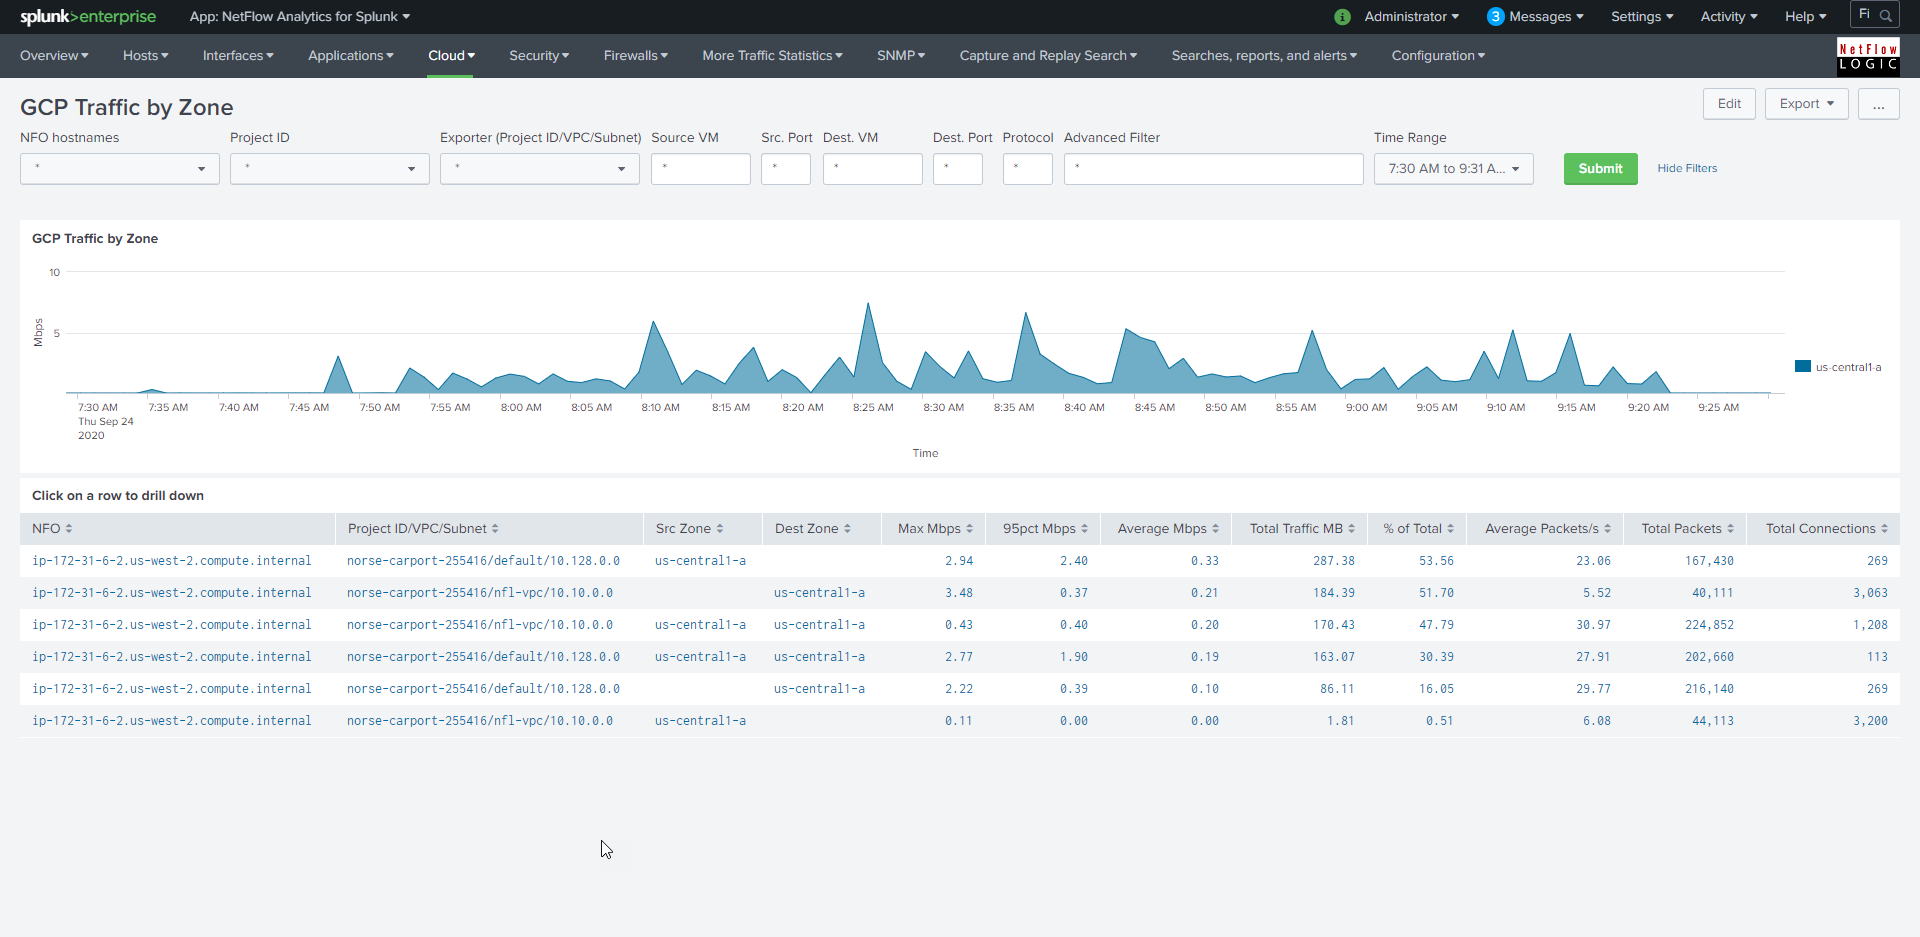
GCP Traffic by Zone