Configuration
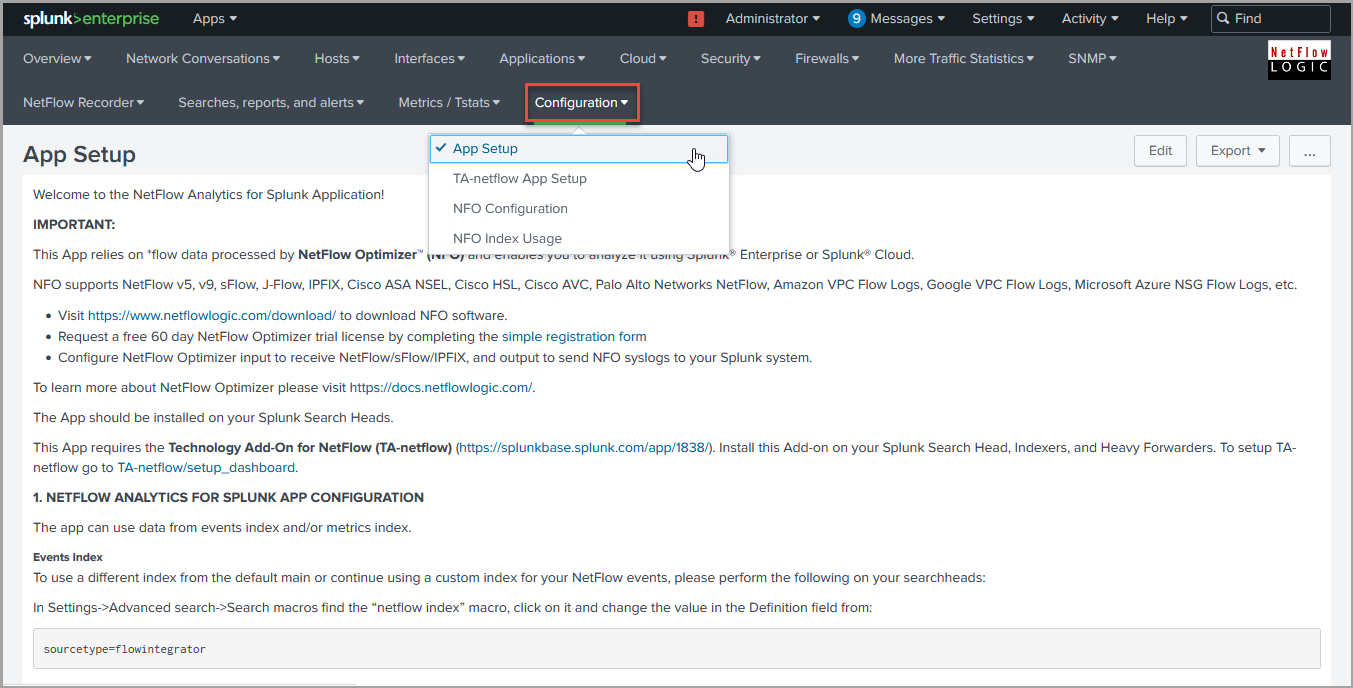
Configuration > App Setup
After App is installed, go to Configuration > App Setup and follow the instructions there.
Most dashboards have Device dropdowns (your NetFlow/sFlow exporter IPs and their SNMP names). These dropdowns are populated automatically by saved searches which are running every 30 minutes. To refresh Device dropdown values, scroll down to the bottom for this page and press ![]() button.
button.
Lookup Files
This App contains the following lookup files, populated by savedsearches:
| CSV File | Description |
|---|---|
| sampling.csv | contains sampling rate for devices reporting sFlow or sampled NetFlow/IPFIX |
| interfaces_20003.csv | contains SNMP information about network devices and interfaces such as device name, interface name, alias, and speed |
| snmp-devices.csv | SNMP based device group drop-downs will be populated based on this lookup file. It is created/updated by save_snmp_devices saved search |
| nfo_exp-group_exp.csv | nfo_exp-group_exp.csv (contains cached values for the following dropdowns: "NFO hostnames"/"Device group"/"Device (Exporter)") |
| nfo_vpc_exp.csv | contains cached values for these dropdowns "NFO hostnames"/"Exporter (VPC)" on the AWS dashboards |
| nfo_gcp_project_vpc_subnet.csv | contains cached values for these dropdowns "NFO hostnames"/"Project ID"/"Exporter (Project ID/VPC/Subnet)" on the Google Cloud dashboards |
| nfo_nsg_vnet.csv | contains cached values for dropdowns "Exporter (Virtual Network)" on the Azure dashboards |
Optionally, you can setup the following lookup files.
1. Device Groups
Create exporters-devices.csv lookup file to group devices into logical groups, e.g. by physical location or department. Device group drop-down will be populated with the list groups from this lookup file.
For example:
nfo_hostname,exp_ip,management_ip,device_group,caption
nfo_server,10.10.10.2,192.168.63.63,"Group A","Cisco ASR 1k SFO"
nfo_server,10.10.10.3,192.168.63.42,"Group A","Cisco Cat 8500 SFO"
nfo_server,10.10.10.4,192.168.63.53,"Group A","Cisco Cat 8500 LAX"
nfo_server,192.168.1.21,192.168.63.44,"Group B","Palo Alto PA-7080"
nfo_server,192.168.1.22,192.168.63.88,"Group B","Palo Alto PA-5280"
Where:
nfo_hostname - is the name of NFO host
exp_ip - is IP address of the device’s NetFlow exporter
management_ip - is the management IP address of the device (the same as exp_ip if the device doesn't have actual management IP)
device_group - is the name of the group where the device belongs
caption - device description used in Device drop-down on Interface Errors and Discards dashboard
Create and import this csv files to Splunk by going to Settings->Lookups->Lookup table files and click on New Lookup Table File, after that upload the lookup file, save it with the same file name.
2. Watched Interfaces
Create watched-interfaces.csv lookup file to identify a list of network interfaces you would like to monitor on Watched Interfaces Utilization dashboard.
For example:
nfo_hostname,exp_ip,if_name
nfo_server,10.10.10.2,Fa0/0
nfo_server,10.10.10.3,Gi0/1
Where:
nfo_hostname - is the name of NFO host
exp_ip - is the exporter IP address of the device
if_name - is the name of the interface (received from SNMP polling)
Create and import this csv files to Splunk by going to Settings->Lookups->Lookup table files and click on New Lookup Table File, after that upload the lookup file, save it with the same file name.
3. Interface Groups
Create interface-groups.csv lookup file to see traffic by network interface groups. This lookup file is used in Interface Groups dashboard.
For example:
nfo_hostname,exp_ip,if_name,if_group
nfo_server,10.10.10.2,Fa0/0,"Group A"
nfo_server,10.10.10.2,Fa0/1,"Group A"
nfo_server,10.10.10.3,Gi0/1,"Group B"
Where:
nfo_hostname - is the name of NFO host
exp_ip - is the exporter IP address of the device
if_name - is the name of the interface (received from SNMP polling)
if_group - is the name of the group where the interface belongs
Create and import this csv files to Splunk by going to Settings->Lookups->Lookup table files and click on New Lookup Table File, after that upload the lookup file, save it with the same file name.
4. My Subnets
Several dashboards (e.g. Microsegmentation Analyzer and Planning, Traffic Analyzer and Planning (based on my-subnets.csv lookup)) enable you to analyze traffic based on your subnets. Create my-subnets.csv lookup file to use these dashboards. It allows you to specify and select subnets within subnets up to four levels.
For example:
subnet,level_1,level_2,level_3,level_4,description
10.0.5.0/29,ClassA,ClassA1,ClassA11,ClassA111,ClassAsubnet111
10.0.5.8/29,ClassA,ClassA1,ClassA11,ClassA112,ClassAsubnet112
10.0.5.16/28,ClassA,ClassA1,ClassA12,ClassA121,ClassAsubnet121
10.0.5.32/27,ClassA,ClassA1,ClassA12,ClassA122,ClassAsubnet122
10.0.5.64/26,ClassA,ClassA2,ClassA21,ClassA211,ClassAsubnet211
10.0.5.128/27,ClassA,ClassA2,ClassA21,ClassA212,ClassAsubnet212
10.0.5.160/27,ClassA,ClassA2,ClassA22,ClassA221,ClassAsubnet221
10.0.5.192/26,ClassA,ClassA2,ClassA22,ClassA222,ClassAsubnet222
172.16.0.0/12,ClassB,ClassB1,ClassB11,ClassB111,ClassBsubnet111
192.168.0.0/16,ClassC,ClassC1,ClassC11,ClassC111,ClassCsubnet111
100::/18,IPv6_1,IPv6_11,IPv6_111,IPv6_1111,IPv6_1_subnet
104::/18,IPv6_2,IPv6_21,IPv6_211,IPv6_2111,IPv6_2_subnet
108::/18,IPv6_3,IPv6_31,IPv6_311,IPv6_3111,IPv6_3_subnet
10c::/18,IPv6_4,IPv6_41,IPv6_411,IPv6_4111,IPv6_4_subnet
5. Interface speed override
Several dashboards use network interface speed received via SNMP polling to calculate relative load of interfaces (% of Usage). If you would like to override the speed for certain interfaces, you can do so by creating the interfaces.csv lookup file.
For example:
nfo_hostname,management_ip,snmp_index,if_name,if_speed
nfo_server,10.10.10.2,0,First interface,1000000
nfo_server,10.10.10.2,1,Second interface,2000000
Where:
nfo_hostname - is the name of NFO host
management_ip - is the management IP address of the device (the same as exp_ip if the device doesn't have actual management IP)
snmp_index - is the snmp index of the interface on the device
if_name - is the name of the interface
if_speed - is the speed of the interface in Kbits / sec
Create and import this csv files to Splunk by going to Settings->Lookups->Lookup table files and click on New Lookup Table File, after that upload the lookup file, save it with the same file name.
6. Critical interfaces
Create an optional critical_interfaces.csv lookup file for Interface Errors and Discards dashboard, if you want to use the show non critical interfaces toggle.
For example:
nfo_hostname,"management_ip","snmp_index","ifName","ifAlias","comment"
localhost","10.0.3.2",1,"VLAN1","VLAN1001","Important interface"
localhost",10.0.5.22,116,"VLAN2","VLAN1002","Uplink"
Where:
nfo_hostname - is the name of NFO host
management_ip - is the SNMP polling IP address of the device
snmp_index - is the index of the interface (received from SNMP polling)
comment - internal comment
Create and import this csv files to Splunk by going to Settings->Lookups->Lookup table files and click on New Lookup Table File, after that upload the lookup file, save it with the same file name.
Run Lookup in Federated Searches
This parameter controls where you want the search to be processed, on your local federated search head, or on the remote search heads of the federated providers you invoke in your search.
The App contains a macro where you can select this option.
[is_local_lookup]
definition = local=false
By default, the search is processed on the remote search heads of the federated providers. To process your lookup on the federated search head of your local Splunk, change this macro as follows:
[is_local_lookup]
definition = local=true
Visualization Parameters
The type of the charts and the stacking mode can be customized on the app level by modifying the visualisation.parameters.csv lookup file in $SPLUNK_ROOT/etc/apps/netflow/lookups/
By default it has these values :
param,value
charting.chart,area
charting.chart.stackMode,stacked
For details on chart formatting parameters, visit: https://docs.splunk.com/Documentation/Splunk/latest/Viz/ChartConfigurationReference
Configuration > TA-netflow App Setup
This technology add-on should be installed on your Splunk Search Head, Indexers, and Heavy Forwarders. In previous versions NFO events were inserted into index flowintegrator. To use or continue using custom index for your flow data, please perform the following:
In Splunk Go to Settings->Indexes and if the flowintegrator index is not present click on the New Index button, enter
flowintegrator
into the Index Name field and click Save.
Alternatively, if you have SSH access to your Splunk servers, please perform the following:
-
Create the file if it does not already exist:
$SPLUNK_ROOT/etc/apps/TA-netflow/local/indexes.confand add the following lines to it:
[flowintegrator]
homePath    = $SPLUNK_DB/flowintegrator/db
coldPath    = $SPLUNK_DB/flowintegrator/colddb
thawedPath = $SPLUNK_DB/flowintegrator/thaweddb -
Restart Splunk
Configuration > NFO Configuration
Get more value out of NetFlow by enabling additional NetFlow Optimizer (NFO) Logic Modules. By default NetFlow Optimizer is preconfigured with one Logic Module enabled – “10067: Top Traffic Monitor”. This Module fees data to most bandwidth monitoring dashboards.
By enabling and configuring other NFO Modules, you activate additional NetFlow analytics to be sent to Splunk, which are visualized in corresponding dashboards. You may enable / disable the entire Module Set or each Module, as depicted below.
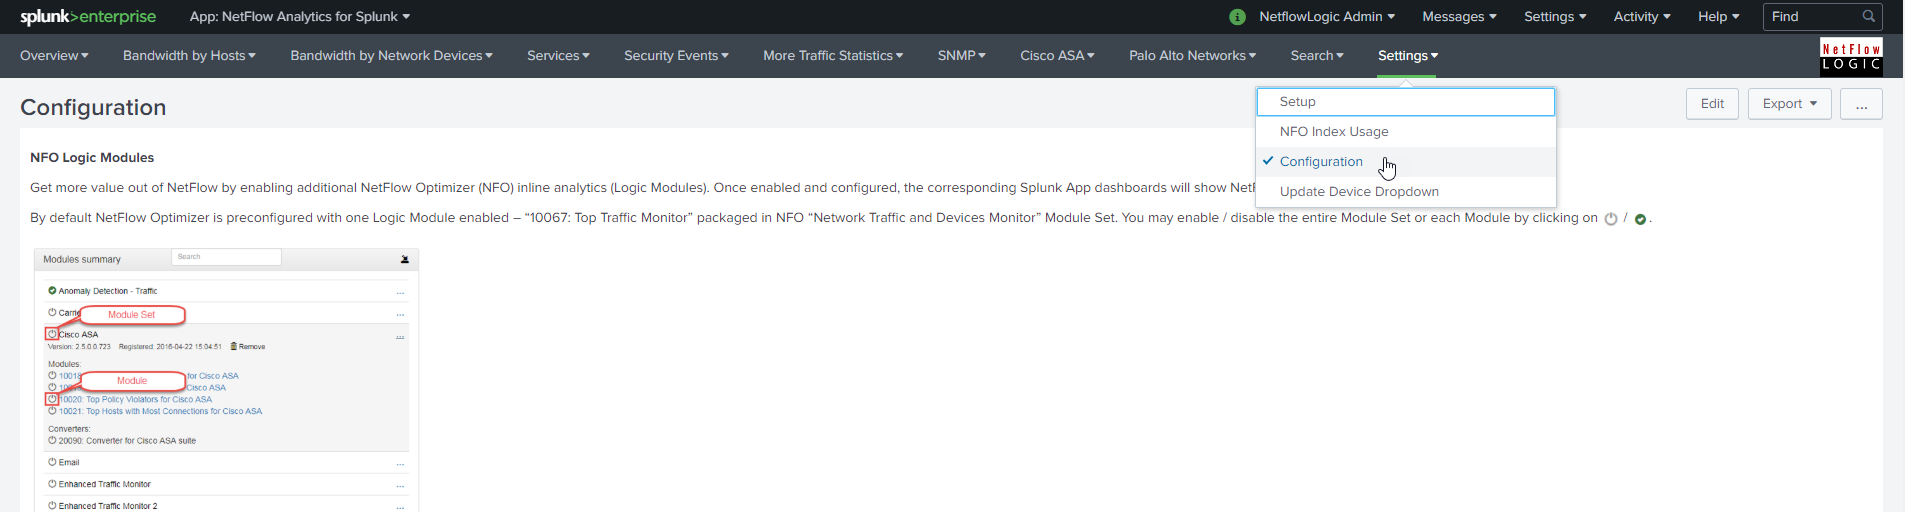
To learn more about NetFlow Optimizer Modules please review NetFlow Optimizer User Guide.
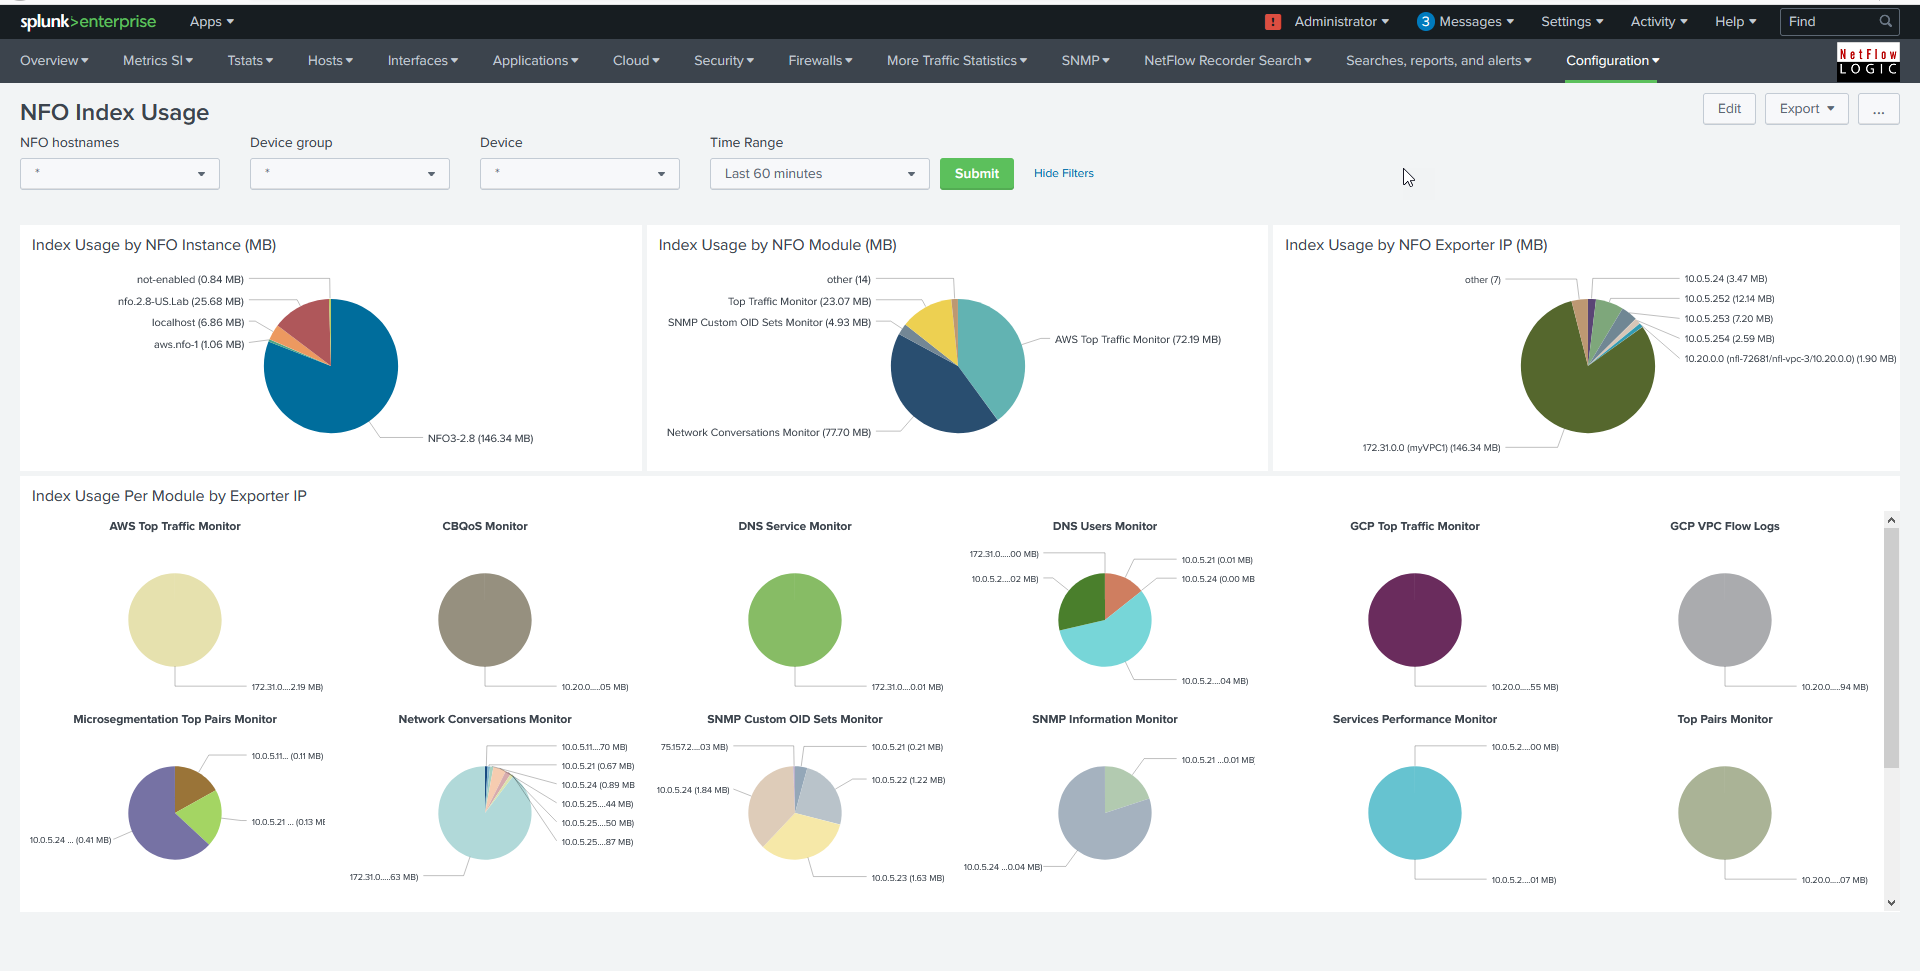
Configuration > NFO Index Usage
This dashboard enables you to analyze how Splunk index is used by NFO instances, various NFO Modules, and network devices. You can see which NFO Module is most chatty, and make configuration changes to assure you use your Splunk license wisely.
Using ifAlias instead of ifName in Interfaces Dashboards
This App shows SNMP inteerface names instead of input / output SNMP indexes. This is achieved through SNMP polling. By defauls ifName is used in the dashboards. If you'd like to use ifAllias instead of ifName, perform the following.
Procedure
- Copy the following macro from
.../default/macros.confto.../local/macros.conf
[get_iface_name(2)]
args = result, param
definition = lookup exporters_devices_lookup nfo_hostname exp_ip OUTPUT management_ip \
            | eval management_ip = if(management_ip=="Unassigned", exp_ip, management_ip) \
            | lookup interfaces_lookup nfo_hostname management_ip snmp_index as $param$ OUTPUT if_name as ifname_interfaces \
            | lookup interfaces_20003_lookup nfo_hostname exp_ip ifIndex as $param$ OUTPUT ifName as ifname_20003 \
            | fillnull value="unknown" ifname_20003 \
            | eval ifname_20003=if(ifname_20003=="unknown",$param$,ifname_20003) \
            | eval $result$ = if(ifname_interfaces=="unknown",ifname_20003,ifname_interfaces) \
            | eval $result$ = mvindex($result$,0)
-
In line 6 change
ifName as ifname_20003toifAlias as ifname_20003 -
Restart Splunk