Dashboards
App Navigation
The App dashboards are organized into logical groups, and could be accessed from the top navigation bar and drop-down menus.

Overview > Traffic Overview
Overview is the default dashboard showing high level traffic statistics, such as top talkers, top listeners, traffic by protocol, traffic by protocol and destination ports, and top devices and interfaces by traffic volume.
Overview > Traffic Overview TS
This is an alternative Overview dashboard built using Splunk tstats command. Tstats requires some fields to be placed in Splunk index at ingestion time, so make sure you have upgraded Technology Add-on for NetFlow (TA-netflow) to version 4.2.4 or later.
Set this dashboard as your default dashboard in case you ingest large volume of NetFlow data for better performance. Go to Splunk Settings > User interface > Navigation menus, select default and change it from:
<nav>
	<collection label="Overview">
		<view name="overview" default="true"/>
		<view name="overview_ts"/>
		<view name="overview_si"/>
to:
<nav>
	<collection label="Overview">
		<view name="overview"/>
		<view name="overview_ts" default="true"/>
		<view name="overview_si"/>
Note: "Open in search" on tstats (TS) dashboards opens the underlying | tstats query, and viewing raw Events from this search is not available.
Overview > Traffic Overview Metrics
This is alternative Overview dashboard in case you ingest NFO output into Splunk Metrics index.
Use this and other Metrics dashboards if you have large volumes of data or running searches for a long time range.
Note: "Open in search" in Metrics dashboards opens the underlying | mstats query, and viewing raw Events from this search is not available
Overview > Traffic Overview SI
This is yet another alternative Overview dashboard built using Splunk summary indexing.
For more information, see Summary Index for Large Volumes of Data.
Use this and other SI dashboards if you have extremely large volumes of data or running searches for a long time range.
Network Conversations
Network Conversations group has dashboards to view traffic statistics reported by the NFO Module Network Conversations. This group includes the following dashboards:
- Network Conversations by Traffic
- Network Conversations by Protocol and Port
- Network Conversations Cyber Threats
- Network Conversations Top Applications
- Network Conversations Top Users
- Network Conversations Top Applications and Users
- Network Conversations Accepts-Rejects
- Network Conversations Devices by Concurrent Connections
- Network Conversations by Duration
- Network Conversations by Country
- Network Conversations by Autonomous Systems
To learn more about this Module, see Network Conversations Monitor in NFO User Guide.
Hosts
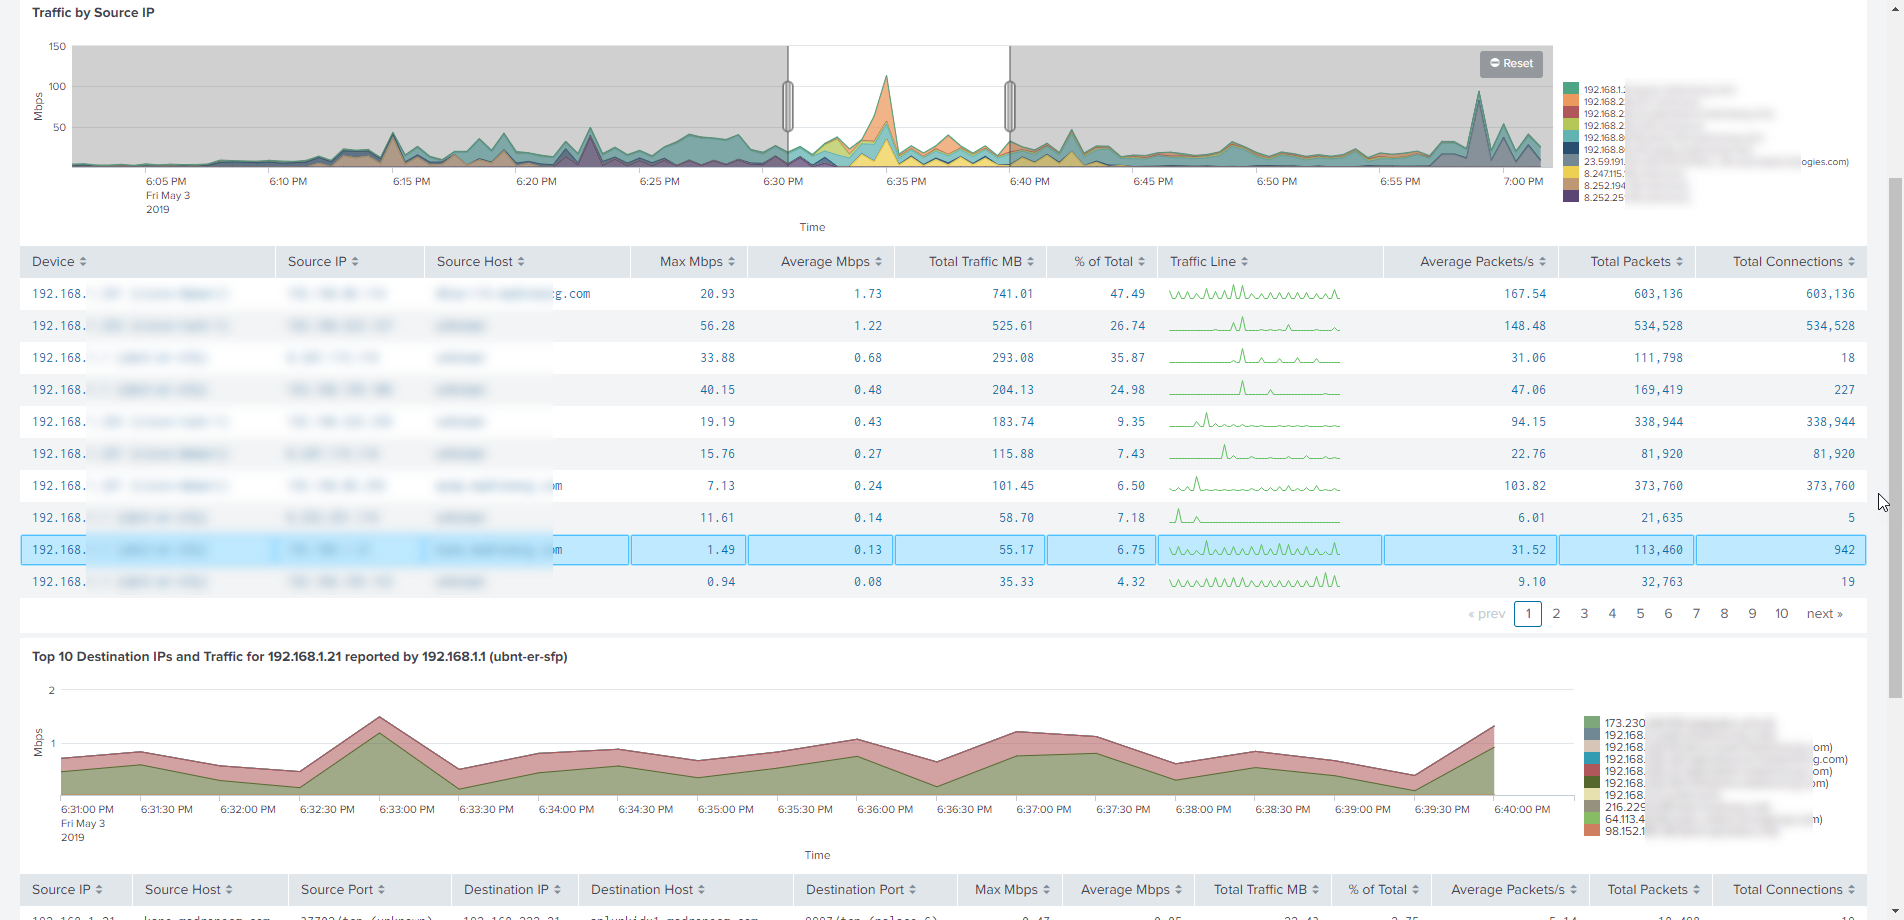
Hosts group has dashboards to view traffic statistics from communicating peers point of view. For example, Traffic by Source IP dashboard shows top talkers, and the ability to drill down to communicating peers as well as seeing network devices that reported these network conversations. This group includes the following dashboards:
- Traffic by Source IP
- Traffic by Source IP with TCP Duration
- Traffic by Destination IP
- Traffic by Protocol and Port
- Traffic by Host Pairs
- Traffic by Protocol
- Traffic by Subnets
- Connection Details
Interfaces
Interfaces group has dashboards to view traffic statistics starting from network devices and interfaces. These dashboards allow you to drill down and see network conversations traversing network devices and interfaces. This group includes the following dashboards:
- Top Devices by Traffic
- Top Devices by Packet Rate
- Interfaces Utilization
- Interfaces Utilization with Traffic by ports, source/destination, CBQOS
- Watched Interfaces Utilization
- Interface Groups
Applications
Applications group has dashboards to view traffic statistics and usage of various applications and services. This group includes the following dashboards:
- Traffic by Protocol and Port
- Service Response Time
- Palo Alto Networks Top Applications
- Palo Alto Networks Top Applications and Users
- Cisco AVC Top Applications
- Cisco AVC Top Applications and Users
Cloud
Cloud group has dashboards to view traffic reported by your public cloud such as Amazon AWS, Microsoft Azure, and Google GPC. This group includes the following dashboards:
Amazon AWS
- AWS Traffic Overview
- AWS Traffic Overview Accepts-Rejects
- AWS Traffic by Source EC2 Instance
- AWS Traffic by Destination EC2 Instance
- AWS Traffic by Protocol and Port
- AWS Traffic by Protocol
- AWS Traffic by VPC
- AWS Traffic by Region
- AWS Traffic by Service
- AWS Visitors by Country
- AWS ENI Utilization
Microsoft Azure
- Azure Traffic Overview
- Azure Traffic Overview Accepts-Rejects
- Azure Inbound Traffic
- Azure Outbound Traffic
- Azure Traffic by Protocol and Port
- Azure Traffic by Protocol
- Azure Traffic by Virtual Network
- Azure Traffic by Region
- Azure Visitors by Country
Google Cloud
- GCP Traffic Overview
- GCP Traffic by Source VM
- GCP Traffic by Destination VM
- GCP Traffic by Protocol and Port
- GCP Traffic by Protocol
- GCP Traffic by VPC
- GCP Traffic by Zone
- GCP Visitors by Country
Security
Security group has dashboards to view malicious and unexpected traffic, as well as denied traffic reported by firewalls. This group includes the following dashboards:
- Cyber Threat Statistics
- DNS Security
- Cisco ASA Top Violators
- Palo Alto Networks Top Violators
- NSX Distributed Firewall Top Violators
- Assets Access Monitor
- Traffic Using Critical Ports
- Communications with Malicious Hosts
Firewalls
Firewalls group has dashboards to view traffic reported by your firewalls:
- Cisco ASA
- Palo Alto Networks
- VMware NSX Distributed Firewall
More Traffic Statistics
This group has various dashboards that don't belong to any groups mentioned above. They are:
- Top Talkers and Destinations with City Geolocations
- TCP Health
- Visitors by Country
- Traffic by Autonomous Systems
- Network Traffic by CBQoS
- Microsegmentation Analyzer and Planning
- Traffic Analyzer and Planning (based on my-subnets.csv lookup)
- Traffic by Subnet Groups
- Traffic by Subnet Groups SI
SNMP
These dashboards visualize SNMP polling feature of NetFlow Optimizer. They include:
- SNMP Polling
- SNMP Traps
- Network Topology with Insights
- Interface Errors and Discards
- SNMP Devices CPU and Memory
NetFlow Recorder
These dashboards enable you to look back in time: search through network traffic captured in NFO and sent to Splunk when NFO "Replay" is pressed.
Searches, Reports, and Alerts
This group contains dashboards to search through raw events during investigations, run online and scheduled reports, and configure alerts.
Metrics / Tstats
This group contains alternative dashboards based on Splunk tstats command, metrics index, and summary indexes. Use these dashboards for better performance when you ingest large volumes of NetFlow data into Splunk.
For more information, visit Summary Index for Large Volumes of Data.
Configuration
This group contains configuration dashboards and Splunk index usage statistics by NFO instances, by network devices, by NFO Modules.
Dashboard Overview
Every dashboard has different filters at the top of the screen to enable further narrowing of the report. For example, the Traffic by Protocol and Port dashboard can be filtered by the NFO hostname, device group, device, source IP/mask, source port, destination IP/mask, destination port, protocol Advanced Filter and time range.
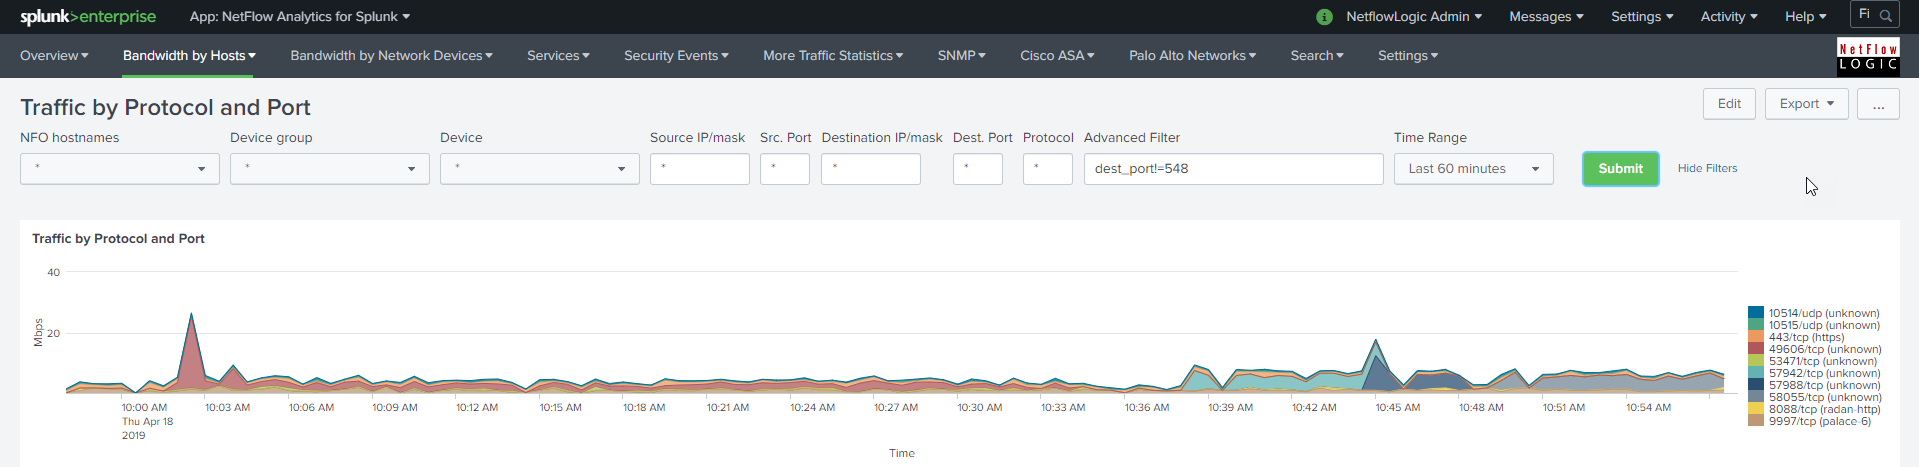
Please note that source and destination IP/mask filters could be specified as subnets (IP/mask), as full IP addresses (199.45.1.45), or as a partial IP address (199.45.1.*).
In Advanced Filter you can specify any SPL to be appended to your search criteria, for example
src_ip!=10.* and dest_ip=192.*
Starting with release 3.7.81 the timeline panel enables you to “pan and zoom” into specific time period. The selected time interval is propagated into all drilldown panels as shown below.