OpenTelemetry
NFO may send two types of OpenTelemetry (OTEL) signals to the collector: Metrics and Logs. You can choose the protocol type (gRPC or HTTP), compression (gzip), authentication type, and other parameters.
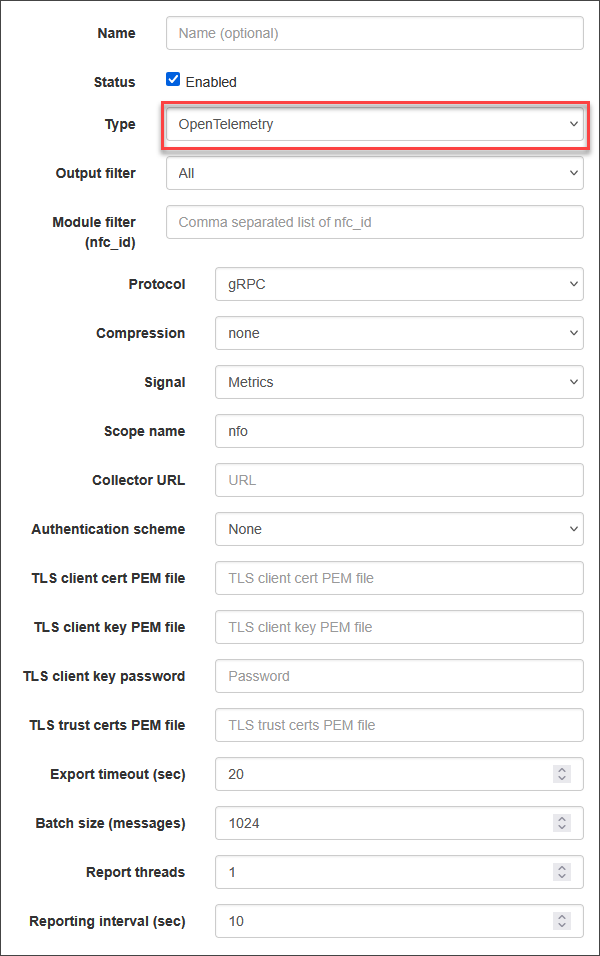
To configure OTEL output, navigate to the 'Outputs' page and click the '+' button. Select the OpenTelemetry output type to send NFO data to the OTEL collector.
| Parameter | Description |
|---|---|
| Protocol | Protocol for data sending: gRPC or HTTP. |
| Compression | Compression type to apply to messages: none or gzip. |
| Signal | Signal type: Metrics or Logs. |
| Scope name | A name uniquely identifying the instrumentation scope. |
| Collector URL | The OpenTelemetry collector endpoint URL. The URL must include the scheme (http or https), IP address or FQDN, and port. For example, https://[host]:4317. If HTTP protocol is selected, URL must include logs or metrics path, e.g. https://[host]:4318/v1/metrics or https://[host]:4318/v1/logs |
| Authentication scheme | Select an authentication scheme: none, basic, bearer, or custom. When Basic authentication is selected, the username and password fields are required. When the Bearer scheme is selected, the token field is required. When the Custom scheme is selected, the Header field is optional, and the token field is required. |
| Username | Basic authentication username. This field is visible only when the Basic authentication scheme is specified. |
| Token/password | Basic authentication password, Bearer authentication token, or custom authentication token (when using the custom authentication type). |
| Header | Custom authentication header. This field is visible only when the custom authentication type is specified. This is an optional field; if not specified, the 'Authorization' HTTP header is used. |
| TLS client cert PEM file | Absolute path to the client certificate PEM file for authentication. May be empty, if username/password authentication is used. |
| TLS client key PEM file | Absolute path to the client key PEM file. Field may be empty, if username/password authentication is used. |
| TLS client key password | Client private key passphrase. |
| TLS trust certs PEM file | Absolute path to OpenTelemetry TLS endpoint certificates. This field may be left empty if the certificates are signed by any global CA. |
| Export timeout (sec) | Wait timeout in seconds before aborting a request (exporting logs or metrics). |
| Batch size (messages) | If logs are exported, the number of logs to be collected before export. If metrics are exported, the number of data points to be collected before export. |
| Report threads | Output threads count (default is 1). This is the number of threads allocated to receive NetFlow data messages produced by NFO and sent to the OpenTelemetry collector |
| Reporting interval (sec) | Time between report thread executions (default: 10) |
Custom Fields Configuration
NFO supports four metric types: Counter, UpDownCounter, Gauge, Histogram.
NFO allows to configure metric types per NFO Module (nfc_id) and field label.
To configure custom nfc_id and field labels mapping create /opt/flowintegrator/etc/opentelemetry-local.conf file and disable-enable the output. The default opentelemetry.conf is:
# This file contains possible settings you can use to configure NFO output to
# OpenTelemetry Metrics. To override the default configuration or add modules,
# create an opentelemetry-local.conf file with the required definitions.
#
# Each stanza controls outputs from different NFO Modules,
# identified in NFO Syslogs/JSONs with nfc_id field.
#
# Use the [default] stanza to define any global settings. Use [<nfc_id>] stanza
# to define NFO Module specific output fields.
#
# Format:
#   [default | <nfc_id>]
#   <field_label> = attribute | attribute_number | counter | up_down_counter
#                   | gauge | histogram | none
#   * = attribute | counter | up_down_counter | gauge | histogram
#
# Where:
# <nfc_id> is the nfc_id field in NFO Syslog/JSON message produced by a specific
#          NFO Logic Module.
# <field_label> is a JSON field name.
#
# * = counter means that all undefined numeric fields are converted to counter.
# * = attribute means that all undefined string fields are sent as attributes.
#
# Both definitions may be used:
#   * = up_down_counter
#   * = attribute
# indicates that all numeric fields are mapped to metrics,
# and all string fields are mapped as attributes.

[default]
nfc_id = attribute_number
exp_ip = attribute
protocol = attribute_number
src_ip = attribute
dest_ip = attribute
src_port = attribute_number
dest_port = attribute_number
input_snmp = attribute_number
output_snmp = attribute_number
src_asn = attribute_number
dest_asn = attribute_number
bytes_in = up_down_counter
bytes_out = up_down_counter
packets_in = up_down_counter
packets_out = up_down_counter
flow_count = up_down_counter
percent_of_total = gauge
t_int = none
time = none
* = up_down_counter
* = attribute

[20103]
nfc_id = attribute_number
exp_ip = none
mgmt_ip = attribute
oid_set = attribute
device_group = attribute
row_num = attribute_number
sysName = attribute
ifIndex = attribute_number
ifName = attribute
ifAlias = attribute
ifDescr = attribute
ifType = attribute
ifMtu = attribute_number
ifSpeed = attribute_number
ifPhysAddress = attribute
ifAdminStatus = attribute
ifOperStatus = attribute
ifInUcastPkts = counter
ifInNUcastPkts = counter
ifInDiscards = counter
ifInErrors = counter
ifOutUcastPkts = counter
ifOutNUcastPkts = counter
ifOutDiscards = counter
ifOutErrors = counter
ifInOctets = counter
ifOutOctets = counter
t_int = none
time = none
* = up_down_counter
* = attribute
OpenTelemetry Output Statistics
You can monitor OpenTelemetry output statistics on the Status page ("Cloud, Custom Output" panel).
The following counts are available (shown only when OpenTelemetry output is enabled) for OTEL Logs:
- OpenTelemetry Logs output generated: Total JSON messages produced by NFO to be processed by the OTEL output.
- OpenTelemetry Logs output sent: Total JSON messages sent to the OTEL collector.
- OpenTelemetry Logs output queue length: JSON messages queue. If queue length is growing, the number of report threads must be increased.
- OpenTelemetry Logs output queue size KB: JSON messages queue size in KB.
- OpenTelemetry Logs dropped: Total JSON messages not sent to the OTEL collector.
The following counts are available (shown only when OpenTelemetry output is enabled) for OTEL Metrics:
- OpenTelemetry Metrics output generated: Total JSON messages produced by NFO to be processed by the OTEL output
- OpenTelemetry Metrics output accepted: Total JSON messages converted to data points.
- OpenTelemetry Metrics output data points sent: Total metric data points sent to the OTEL collector.
- OpenTelemetry Metrics output data points dropped: Total metric data points failed to send to the OTEL collector.
- OpenTelemetry Metrics output queue length: JSON messages queue. If queue length is growing, the number of report threads must be increased.
- OpenTelemetry Metrics output queue size KB: JSON messages queue size in KB.
- OpenTelemetry Metrics dropped: Total JSON messages not converted to data points.
Splunk Observability Cloud Integration
You can integrate NetFlow Optimizer (NFO) with Splunk Observability Cloud. There are two options for exporting data points to Splunk Observability Cloud:
- Send metrics directly to Splunk Observability Cloud
- Send metrics to the Splunk Distribution of the OpenTelemetry Collector: https://docs.splunk.com/observability/en/gdi/opentelemetry/opentelemetry.html
To send NFO output directly to Splunk Observability Cloud, select the NFO output type "OpenTelemetry." In the OTEL output editor form, enter the following fields:
- Type: OpenTelemetry
- Output filter: Modules output only
- Module filter (nfc_id): The list of NFO Modules' nfc_ids to be sent to Splunk Observability Cloud Metrics. This is an optional parameter, if not set, all messages are sent
- Protocol: HTTP
- Compression: gzip
- Signal: Metrics
- Scope name: Enter instrumentation scope name, e.g., "nfo"
- Collector URL: Enter Splunk Observability data points endpoint (where
<REALM>is your realm (e.g., eu0, us0)):
https://ingest.<REALM>.signalfx.com/v2/datapoint/otlp
- Authentication scheme: Custom
- Header: X-SF-TOKEN
- Token: Enter your organization Ingest token. For more information, visit https://docs.splunk.com/observability/en/admin/authentication/authentication-tokens/org-tokens.html
- TLS parameters: Do not enter, leave blank
- Other parameters: Leave default values
To send NFO output to the Splunk Distribution of the OpenTelemetry Collector, you need to configure the OpenTelemetry output according to your collector's receivers configuration. For details about the collector configuration, please visit: https://docs.splunk.com/observability/en/gdi/opentelemetry/components.html
The minimum collector configuration yaml-file may be the following:
receivers:
  otlp:
    protocols:
      grpc:
        endpoint: "${SPLUNK_LISTEN_INTERFACE}:4317"
      http:
        endpoint: "${SPLUNK_LISTEN_INTERFACE}:4318"

processors:
  batch:

  memory_limiter:
    check_interval: 2s
    limit_mib: ${SPLUNK_MEMORY_LIMIT_MIB}

exporters:
  otlphttp:
    metrics_endpoint: https://ingest.us0.signalfx.com/v2/datapoint/otlp
    headers:
      X-SF-Token: <access_token>

service:
  pipelines:
    metrics:
      receivers: [otlp]
      processors: [memory_limiter, batch]
      exporters: [otlphttp]
Please set up the Splunk Distribution of the OpenTelemetry Collector according to your environment. For instance, enter your access token, modify the realm, configure TLS for OTLP receivers, customize OTLP/HTTP exporter queue, or even use a different exporter.