More Traffic Statistics
Top Talkers and Destinations with City Geolocations
To see data in this dashboard enable and configure Module 10867: Top Traffic Monitor Geo City. Please refer to NetFlow Optimizer User Guide for details.
This dashboard is visualizing the Top Talkers and Top Destinations on maps and lists more details in tables.
With the GeoIP source checkbox you can set to use Splunk-included GeoIP_(typically updated with Splunk upgrades) or up-to-date GeoIP information provided by NFO.

TCP Health
To see data in this dashboard enable and configure Module 10060: TCP Health. Please refer to NetFlow Optimizer User Guide for details.
The TCP Health dashboard monitors and detects top hosts with the most TCP Resets. Top hosts are defined by percent of TCP resets to the total number of Resets for definitive NetFlow exporter or by percent of TCP resets to the total number of host’s connections. The TCP Health dashboard shows top hosts with most count of failed TCP connections and top hosts with largest share of failed TCP connections.

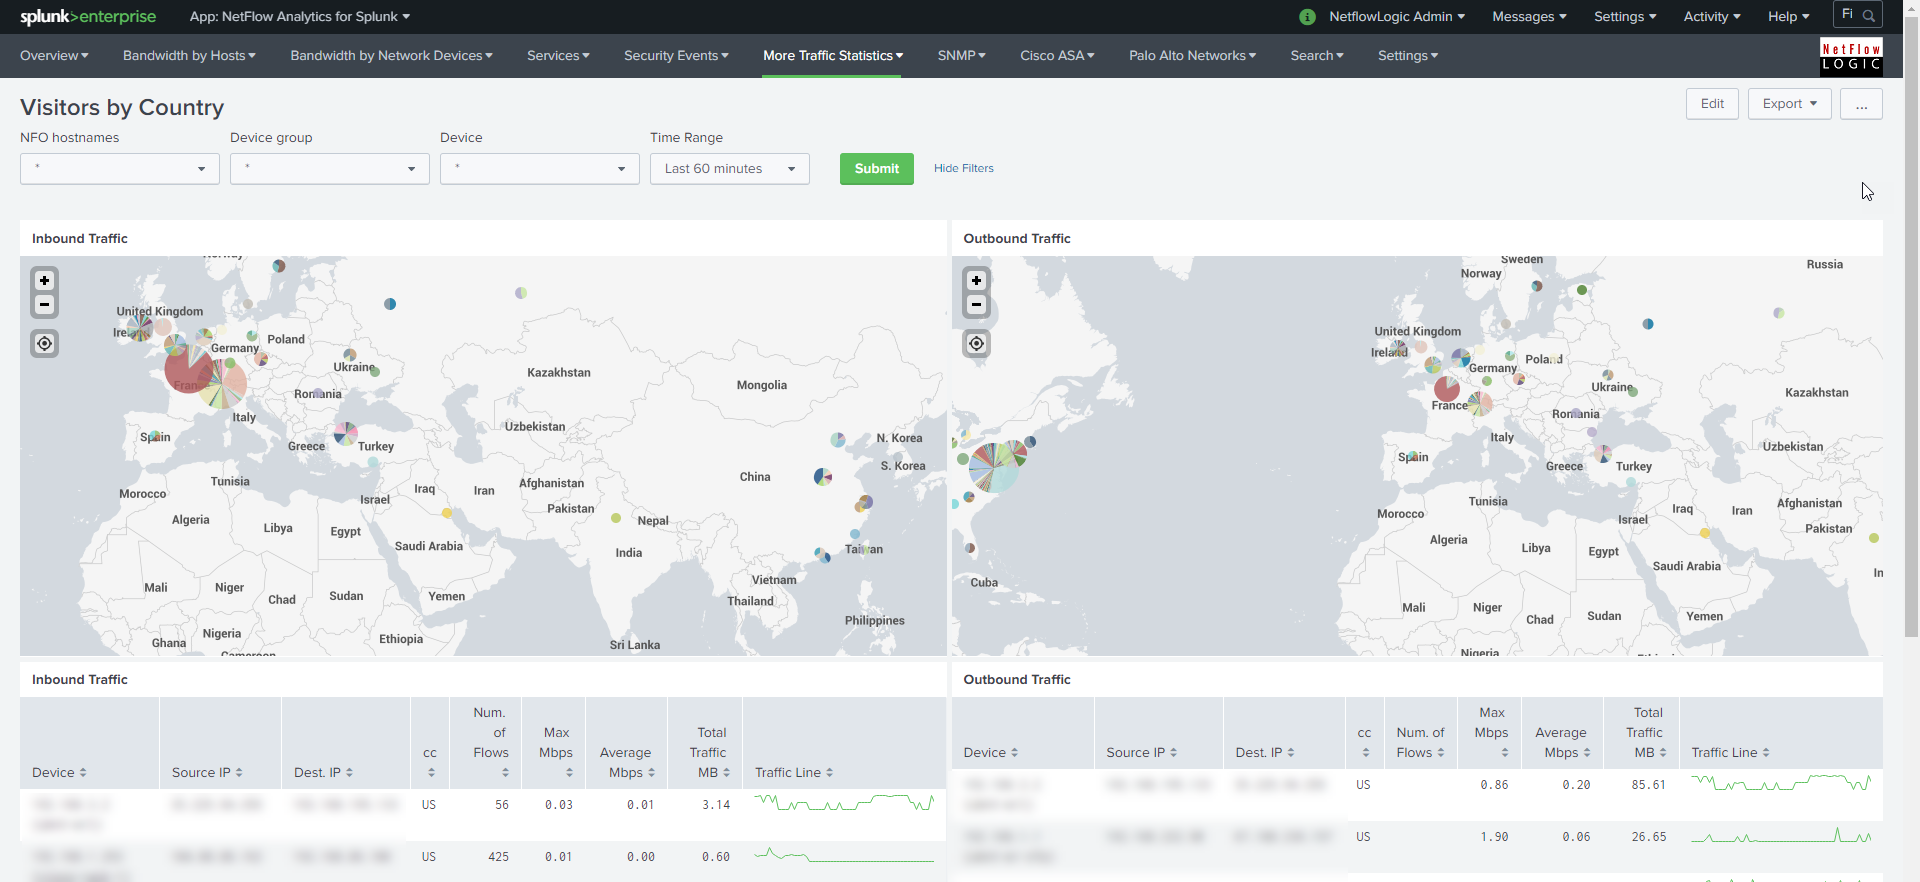
Visitors by Country Dashboard
The Visitors by Country dashboard shows geographical locations of Source IP for inbound traffic and Destination IP for outbound traffic. You need to enable Module 10040: Visitors by country.
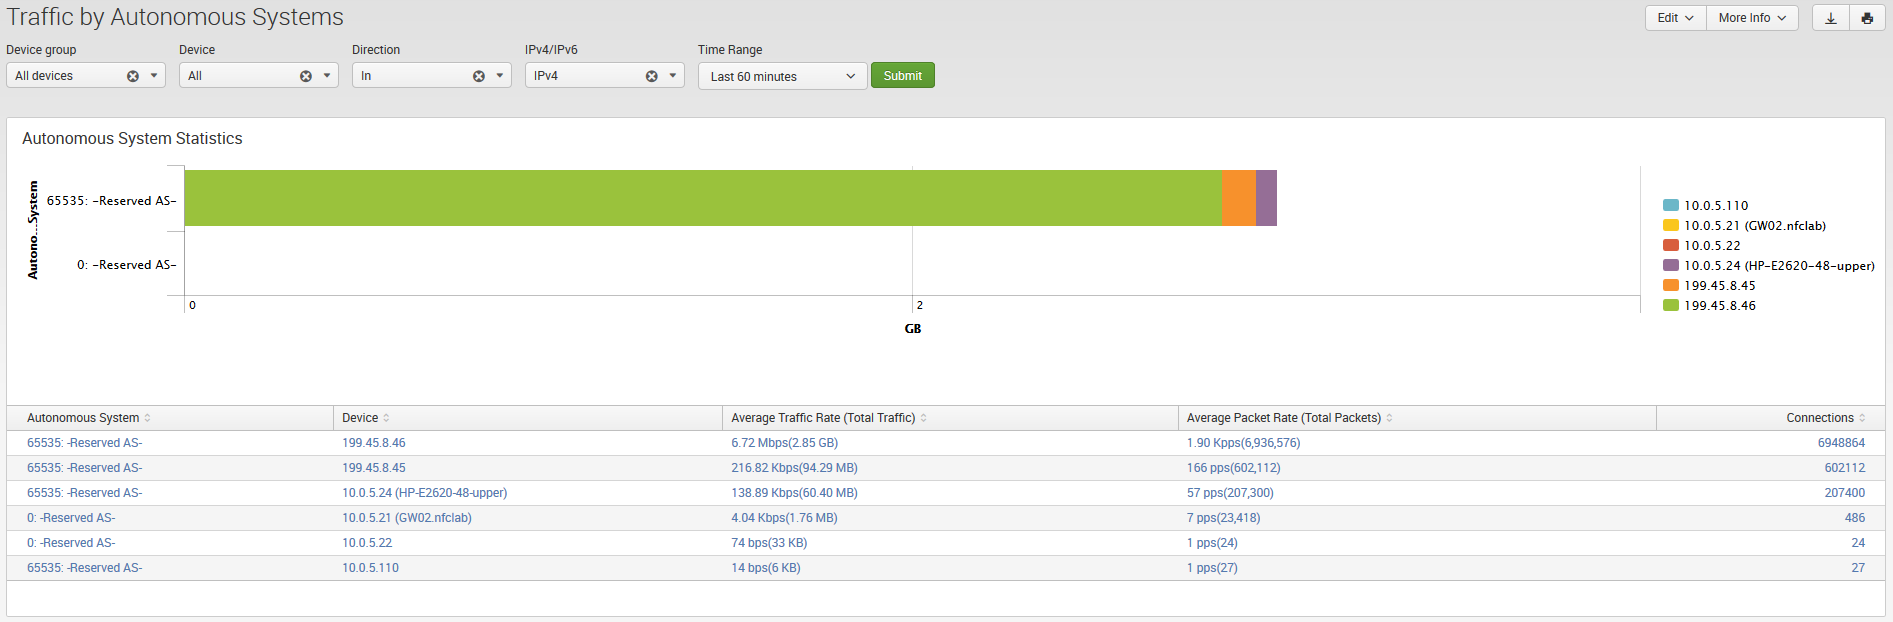
Traffic by Autonomous Systems Dashboard
The Traffic by Autonomous Systems (AS) dashboard monitors traffic by AS. To see data in this dashboard enable and configure Module 10066: Autonomous Systems Monitor.
Use the filtering options and time picker at the top of the dashboard to select the time interval and narrow down your search results. Select if you want to see incoming or outgoing traffic by AS. Indicate if you want to see statistics for IPv4 or IPv6 or both.
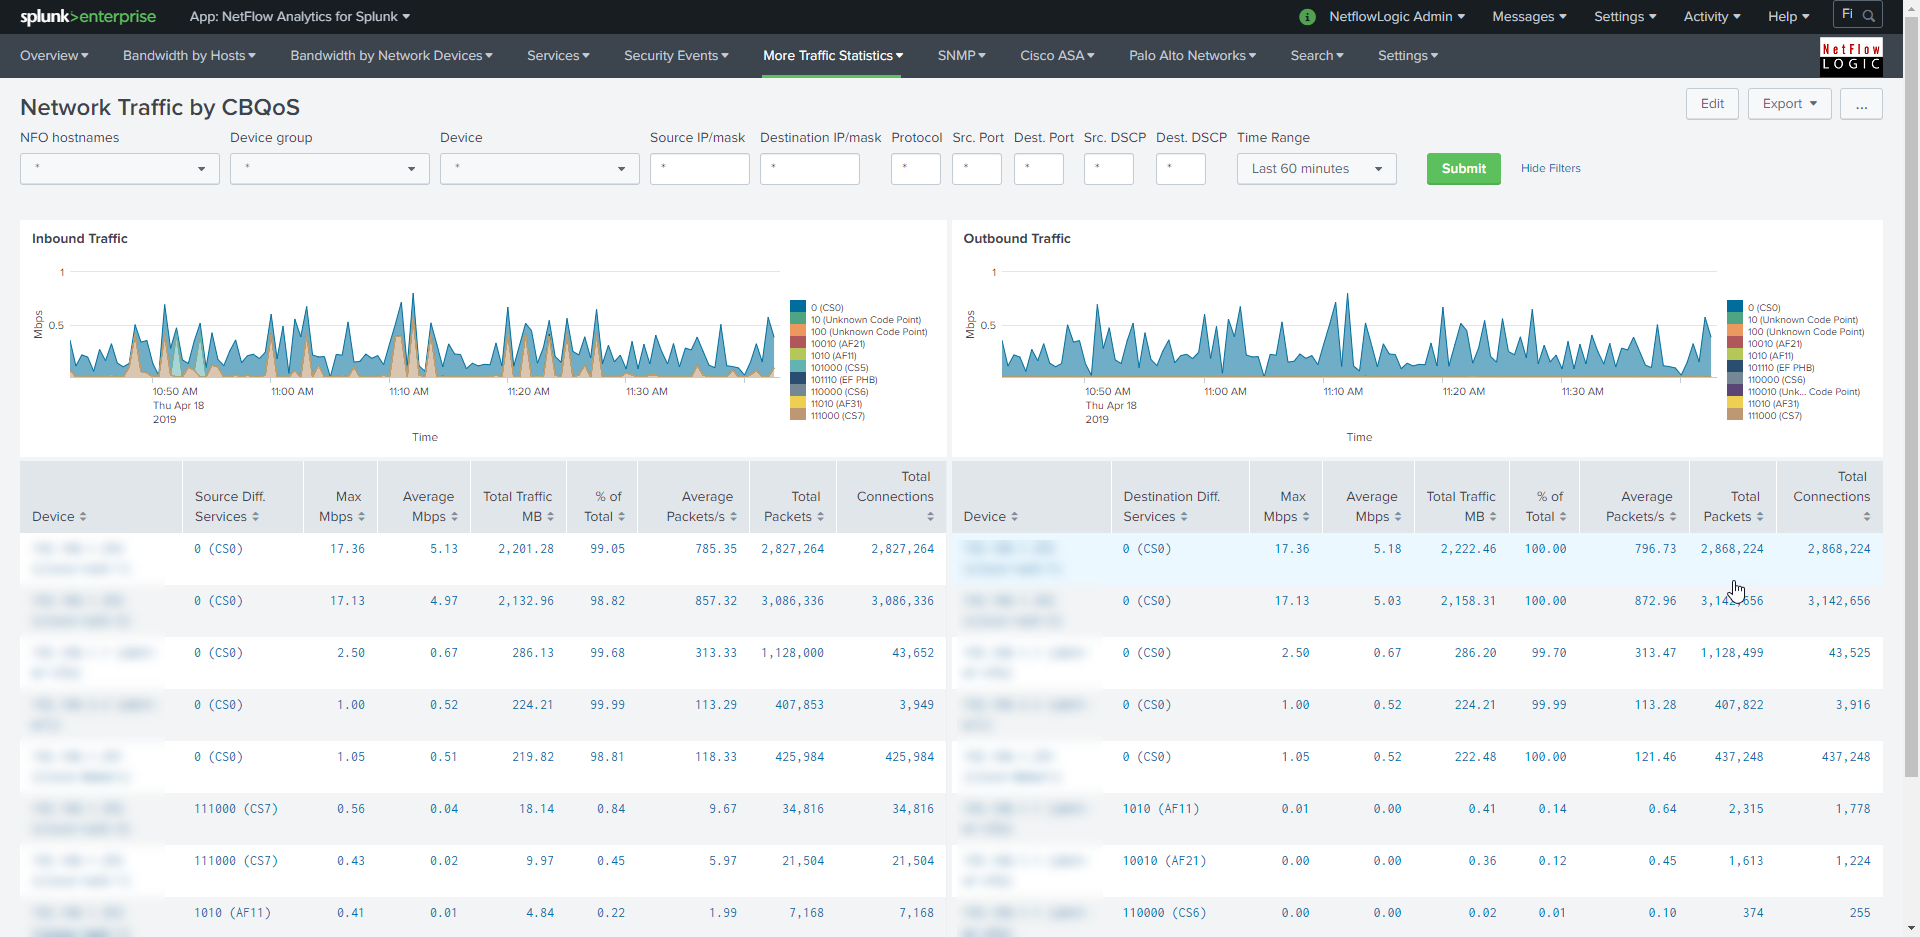
Network Traffic by CBQoS Dashboard
The Network Traffic by CBQoS dashboard enables your organization to analyze and prioritize network traffic by Quality of Service (QoS). Using this dashboard you will be able to see how QoS policy is applied in each of your network device where it is enabled and reported, and if necessary tweak Type of Service (TOS) settings. To see data in this dashboard enable Module 10066: CBQoS Monitor.
Use the filtering options and time picker at the top of the dashboard to select the time interval and narrow down your search results.
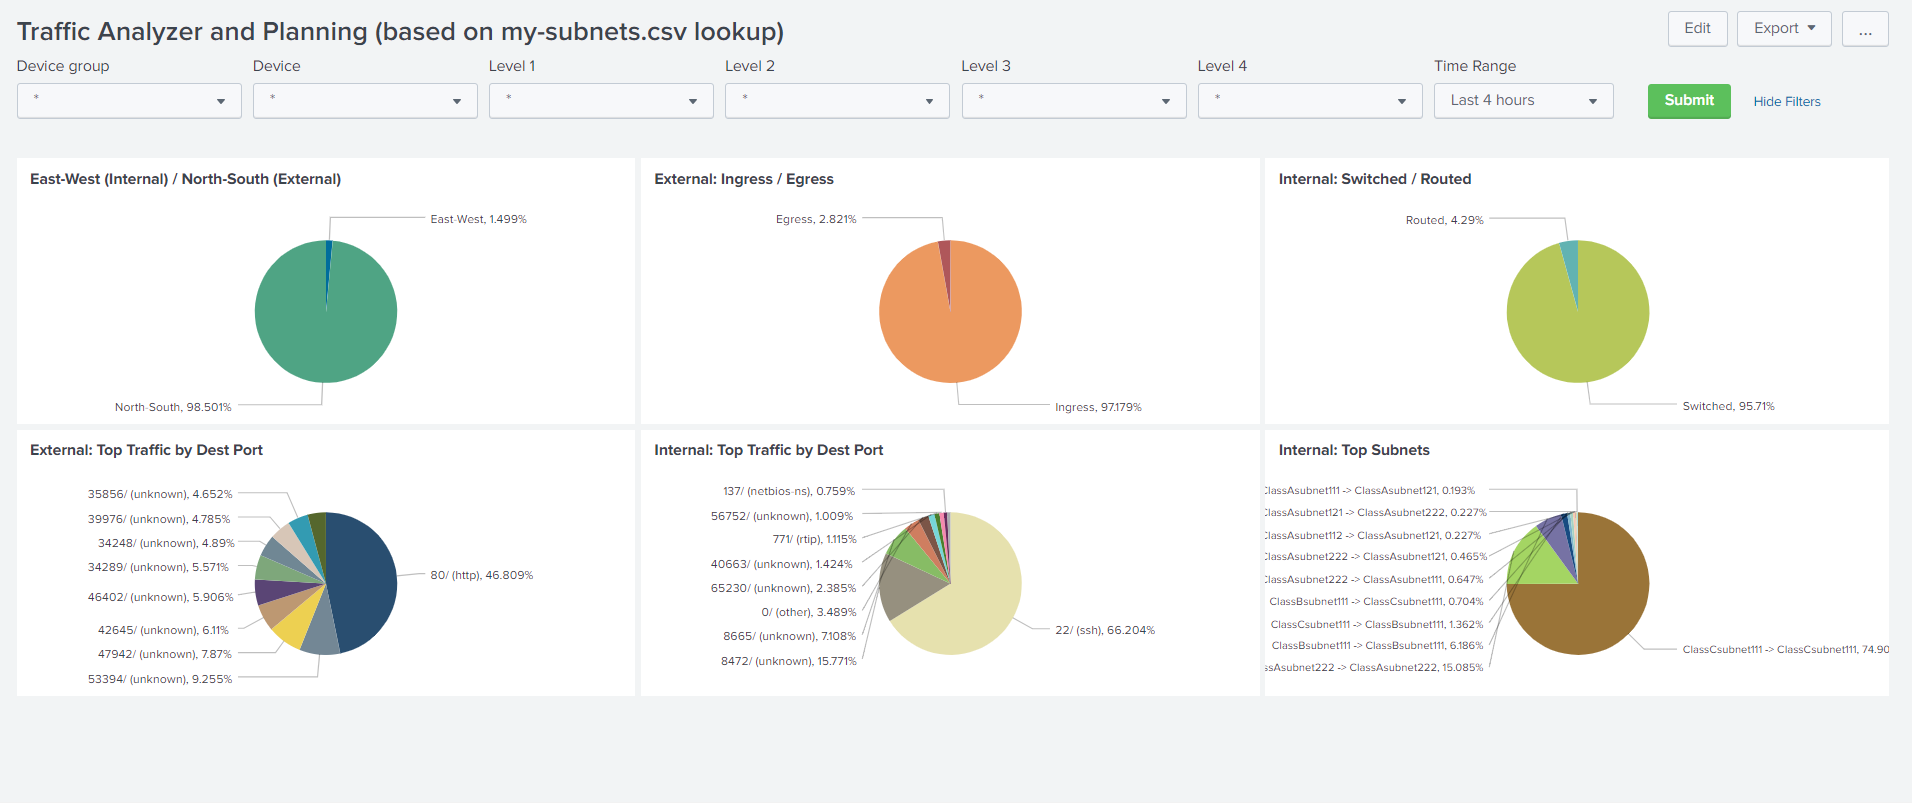
Traffic Analyzer and Planning (based on my-subnets.csv lookup)
This dashboard is using this lookup $SPLUNK_HOME/etc/apps/netflow/lookups/my-subnets.csv file to determine traffic in and out of your datacenter (East-West, South-North) as well as other subnet based statistics. It supports up to four-level hierarchy, and should be created in the format shown in this example:
| Subnet address | Netmask | Range of addresses | Level1 | Level2 | Level3 | Level4 |
|---|---|---|---|---|---|---|
| 10.0.0.0/10 | 255.192.0.0 | 10.0.0.0 - 10.63.255.255 | ClassA | Canada | Ontario | Toronto |
| 10.64.0.0/10 | 255.192.0.0 | 10.64.0.0 - 10.127.255.255 | ClassA | Canada | Alberta | Edmonton |
| 10.128.0.0/11 | 255.224.0.0 | 10.128.0.0 - 10.159.255.255 | ClassA | USA | California | Los-Angeles |
| 10.160.0.0/11 | 255.224.0.0 | 10.160.0.0 - 10.191.255.255 | ClassA | USA | California | San-Francisco |
| 10.192.0.0/11 | 255.224.0.0 | 10.192.0.0 - 10.223.255.255 | ClassA | USA | Oregon | Portland |
| 10.224.0.0/11 | 255.224.0.0 | 10.224.0.0 - 10.255.255.255 | ClassA | USA | Oregon | Eugene |
The dashboards provides filters to apply to traffic statistics, so you can select all or the appropriate segment / sub-segment of your network.
Microsegmentation Analyzer and Planning
This dashboards relies on Microsegmentation Analytics NFO Module. This dashboard also is using this lookup $SPLUNK_HOME/etc/apps/netflow/lookups/my-subnets.csv file to determine traffic in and out of your datacenter (East-West, South-North) as well as other subnet based statistics
