Hosts
This section covers the dashboards and reports for monitoring traffic to and from hosts in your network, such as top talkers, top listeners, top host pairs, and many others.
Traffic by Source IP dashboard
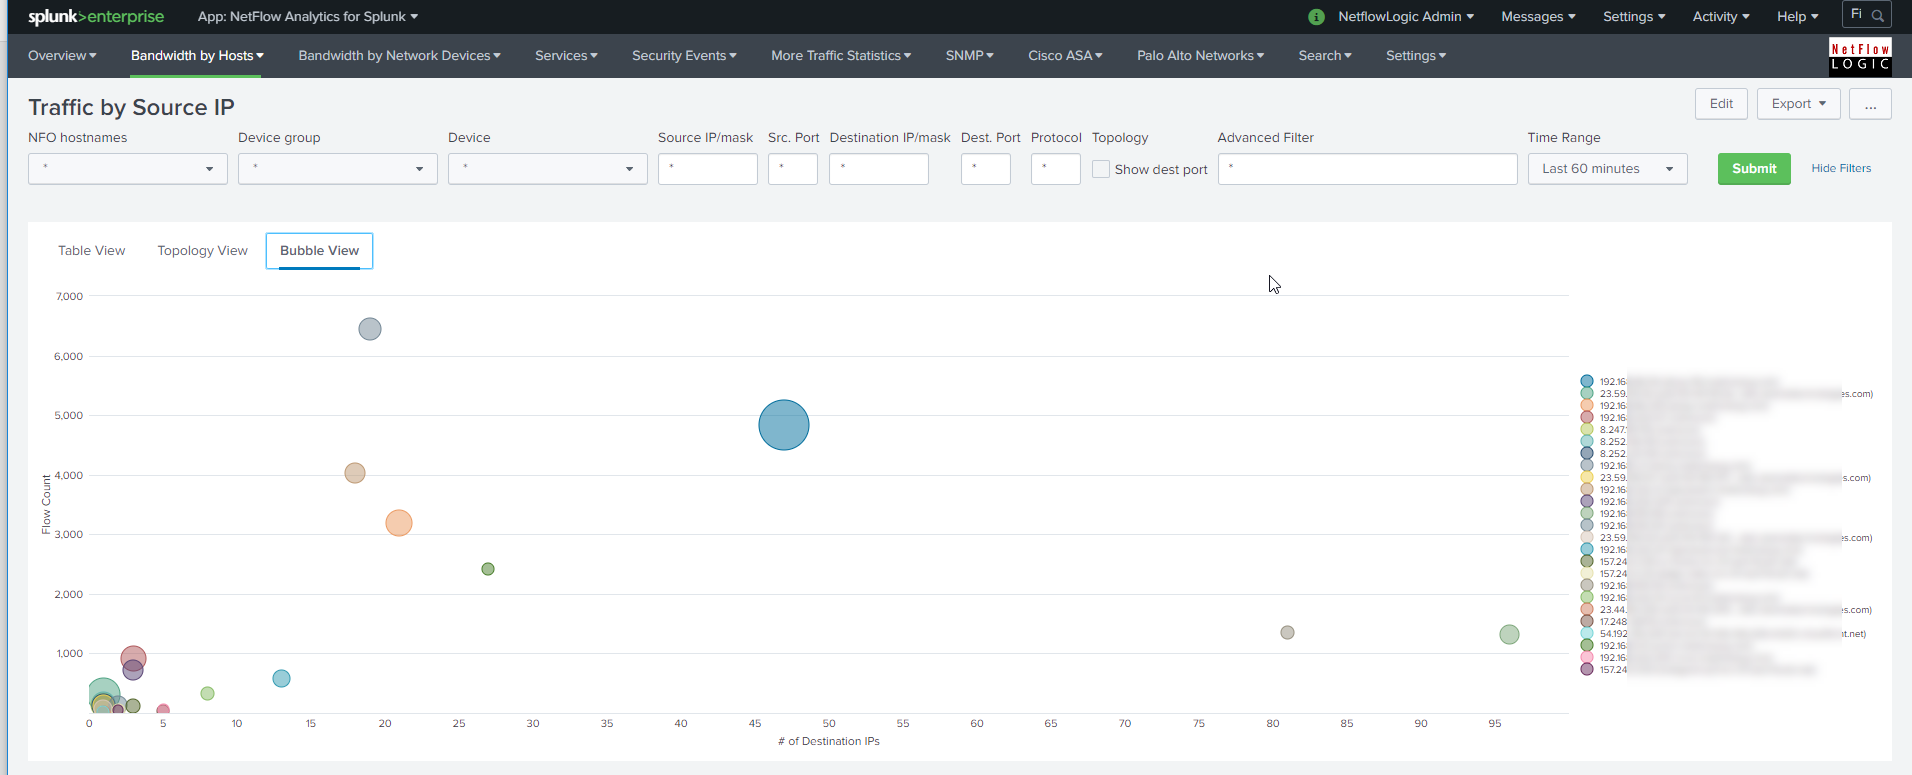
The Traffic by Source IP dashboard (a.k.a. Top Talkers) monitors host which generate most traffic in your network. It is useful for real time or historical network utilization and bandwidth monitoring. The dashboard shows maximum and average traffic speed and volume, as well as packet rate and connections generated by each host.
Use the filtering options and time picker at the top of the dashboard to select the time interval and narrow down your search results.

The Traffic by Source IP dashboard allows viewing talker traffic details – just click on the talker host IP or name, and drill down panel opens below showing all traffic destinations, including ports, network device interfaces, and traffic and packet rate details.
You may also select Topology view to see graphical representation of Top talkers communications, or Bubble view to see hosts with most flows and destinations.

Traffic by Destination IP dashboard
The Traffic by Destination IP dashboard (a.k.a. Top Listeners) monitors host which receive most traffic in your network. As Traffic by Source IP, it is useful for real time or historical network utilization and bandwidth monitoring. The dashboard shows traffic maximum and average speed and volume, as well as packet rate and connections received by each host.
Use the filtering options and time picker at the top of the dashboard to select the time interval and narrow down your search results.
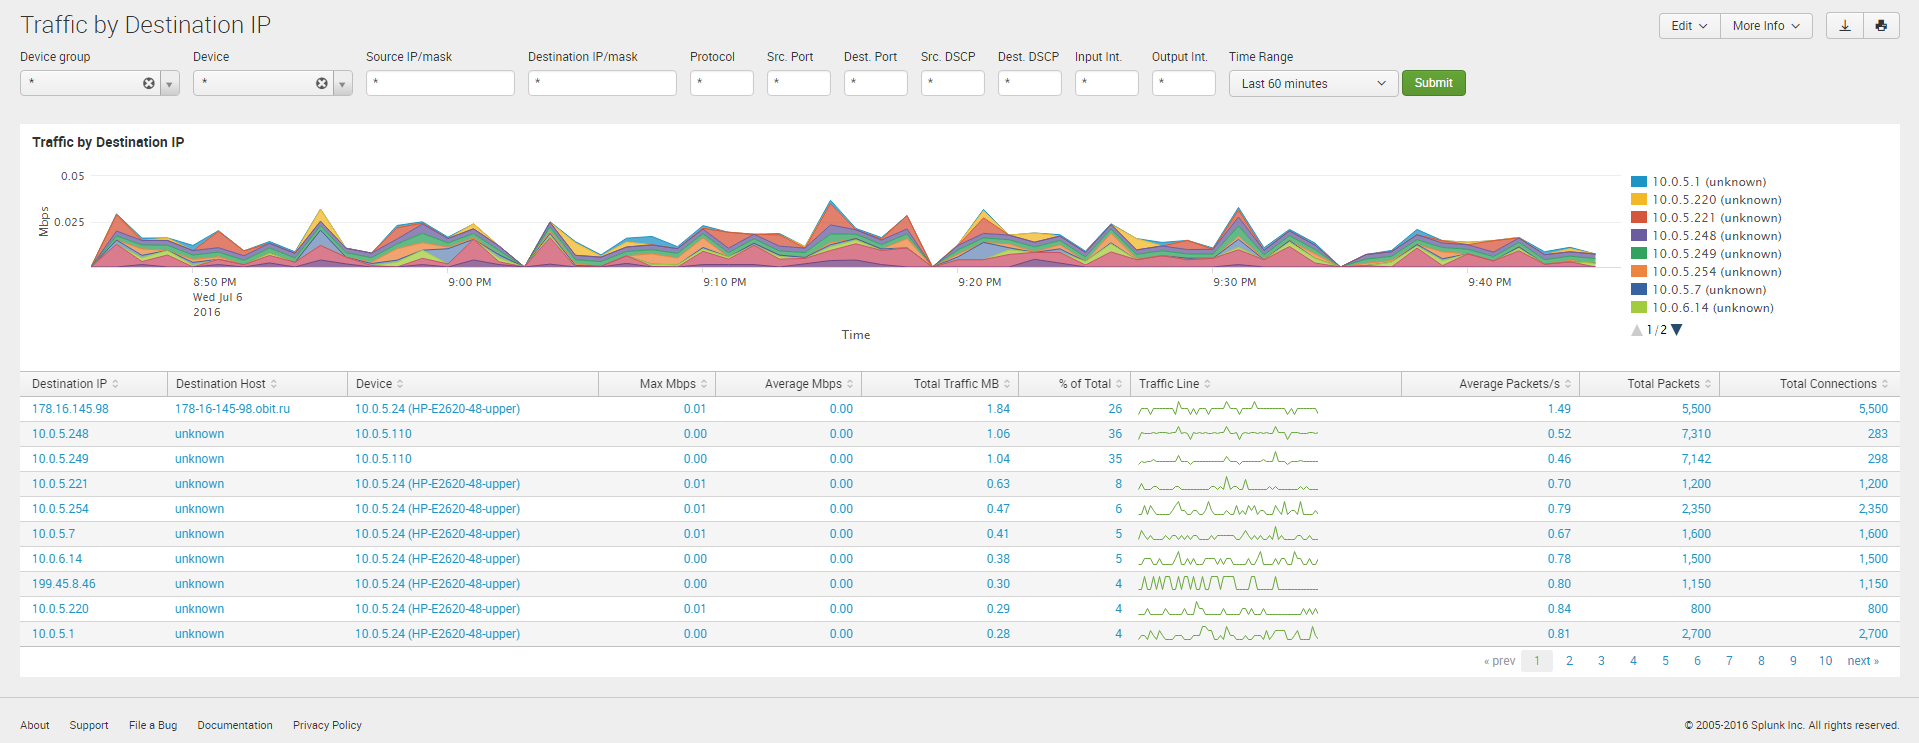
The Traffic by Destination IP dashboard allows viewing listener traffic details – just click on the listener host IP or name, and drill down panel opens below showing all traffic sources, including ports, network device interfaces, and traffic and packet rate details.
Traffic by Protocol and Port
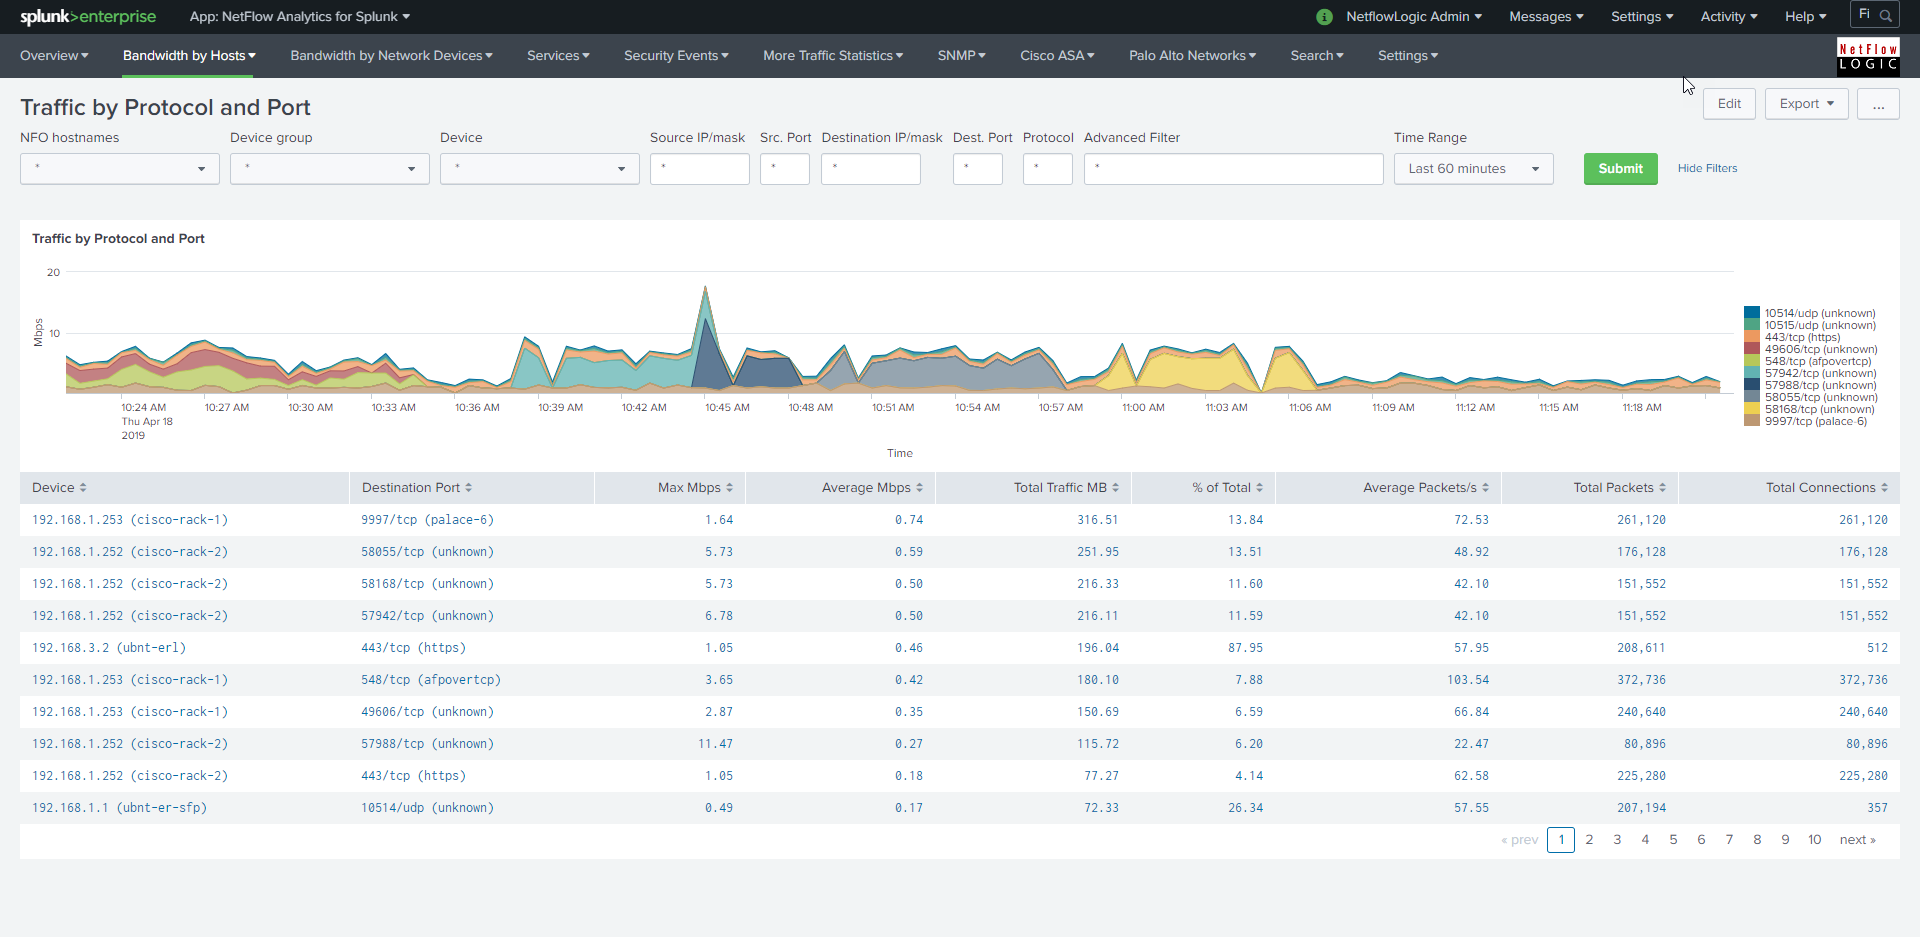
The Traffic by Protocol and Port dashboard monitors traffic in your network by Service Name and Transport Protocol Port Number (a.k.a Destination port). The App is packaged with services.csv lookup file, which is used to display the service name and protocol, according to IANA: (http://www.iana.org/assignments/service-names-port-numbers/service-names-port-numbers.xhtml).
Traffic by Host Pairs Dashboard
The Traffic by Host Pairs dashboard shows consolidated bidirectional flows, sorted by traffic volume. You need to enable Module 10064: Top Pairs Monitor in order to see data in this dashboard. The Traffic by Host Pairs dashboard contains a timeline panel showing top 10 host pairs’ traffic by volume, and the table showing top 100 host pairs with details, such as traffic volume and speed, packet rate, and connections count.

Traffic by Subnets Dashboard
The Traffic by Subnets dashboard monitors subnets specified in NFO Module 10011: Network Subnets Monitor configuration. Please refer to NetFlow Optimizer User Guide for details. The Traffic by Subnets dashboard is useful for real time and historical monitoring of bandwidth utilization in specified subnets.
The dashboard shows traffic In, Out, and in Both directions. Traffic for the top 10 by traffic volume monitored subnets is shown in timeline panels. The table below shows for each subnet such details as Source IP, Traffic speed and volume by direction, as well as packet rate information.

Traffic by Protocol Dashboard
The Traffic by Protocol dashboard monitors traffic in your network by transport protocol, going through each of the network devices. It is useful for real time or historical monitoring of you traffic composition. The App is packaged with protocols.csv lookup file, which is used to display the protocol name and number, according to IANA: (http://www.iana.org/assignments/protocol-numbers/protocol-numbers.xhtml).
Use the filtering options and time picker at the top of the dashboard to select the time interval and narrow down your search results.
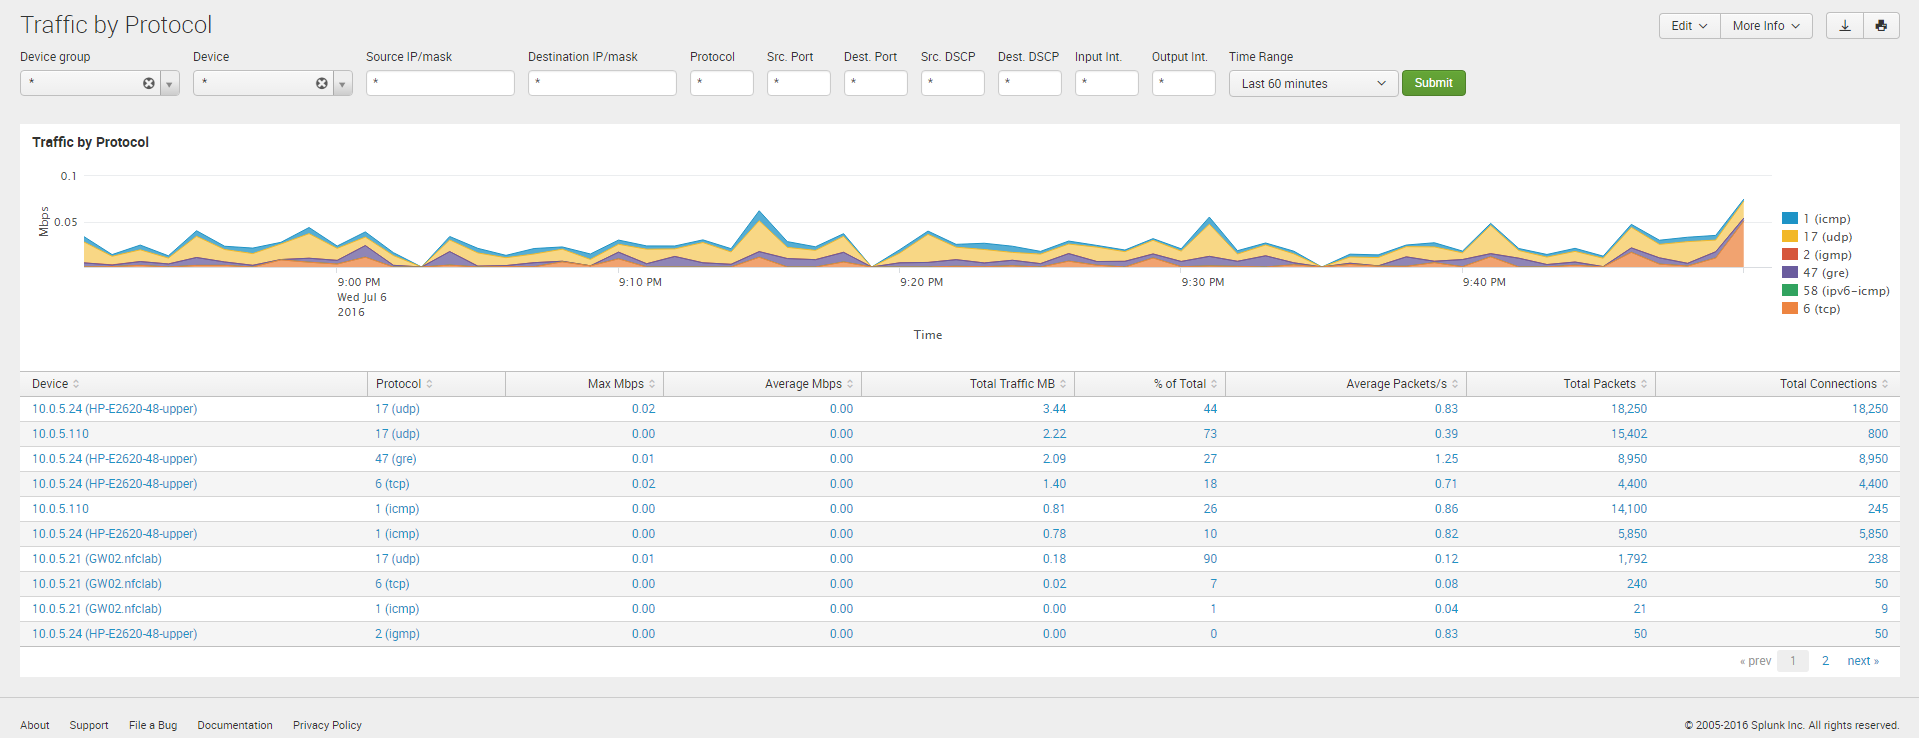
The Traffic by Protocol dashboard allows viewing traffic details for each protocol – just click on the protocol in the table below the graph, and drill down panel opens below showing all traffic details for the selected protocol, including source and destination hosts and port numbers, network device interfaces, and traffic speed and volume, packet rate, and connections.
Connections Dashboards
Traffic dashboards described in the previous sections are based on NFO Modules that consolidated flow data and report top hosts by volume (Modules 10011, 10064, 10067 – default Module). Connections dashboards are based on NFO Module 10063, which reports top hosts by the number of connections regardless of traffic volume. There four dashboards to monitor host by connections.
- Connections by Source IP
- Connections by Destination IP
- Connections by Protocol and Port
- Connections by Protocol
These dashboards contain graphs and table with traffic details similar to corresponding Traffic dashboards.