Interfaces
In comparison to Hosts dashboards, which are host centric, the Interfaces dashboards are device (routers, firewalls, VLAN’s) and network interface centric, tracking the ingress and egress traffic.
Top Devices by Traffic Dashboard
The Top Devices by Traffic dashboard monitors network devices with most traffic in your network. It is useful for real time or historical network utilization and bandwidth monitoring. The dashboard shows maximum and average traffic speed as well as packet rate traversing each network device.
Use the filtering options and time picker at the top of the dashboard to select the time interval and narrow down your search results.
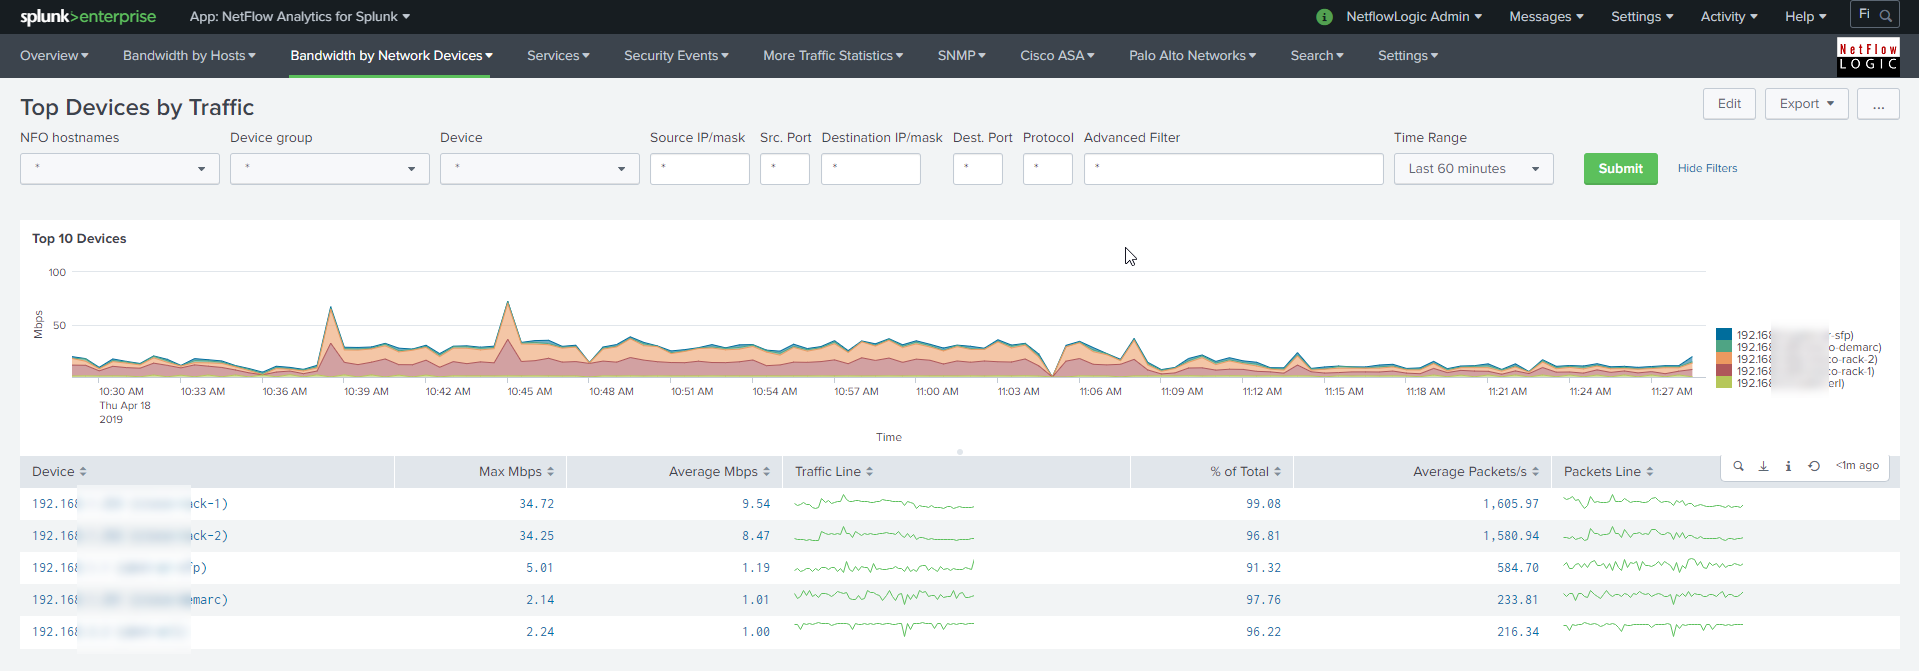
The Top Devices by Traffic dashboard allows viewing network traffic details – just click on one of the devices, and drill down panel opens below showing traffic composition by each interface. Further drilldown shows traffic speed statistics (Min, Max, Average, Standard Deviation), and hosts communicating over the selected interface.
Top Devices by Packet Rate Dashboard
The Top Devices by Packet Rate dashboard is similar to Top Devices by Traffic dashboard, but the network devices are sorted by packet rate rather than traffic volume.
You need to enable Module 10068: Top Packets Monitor in order to see data in this dashboard.
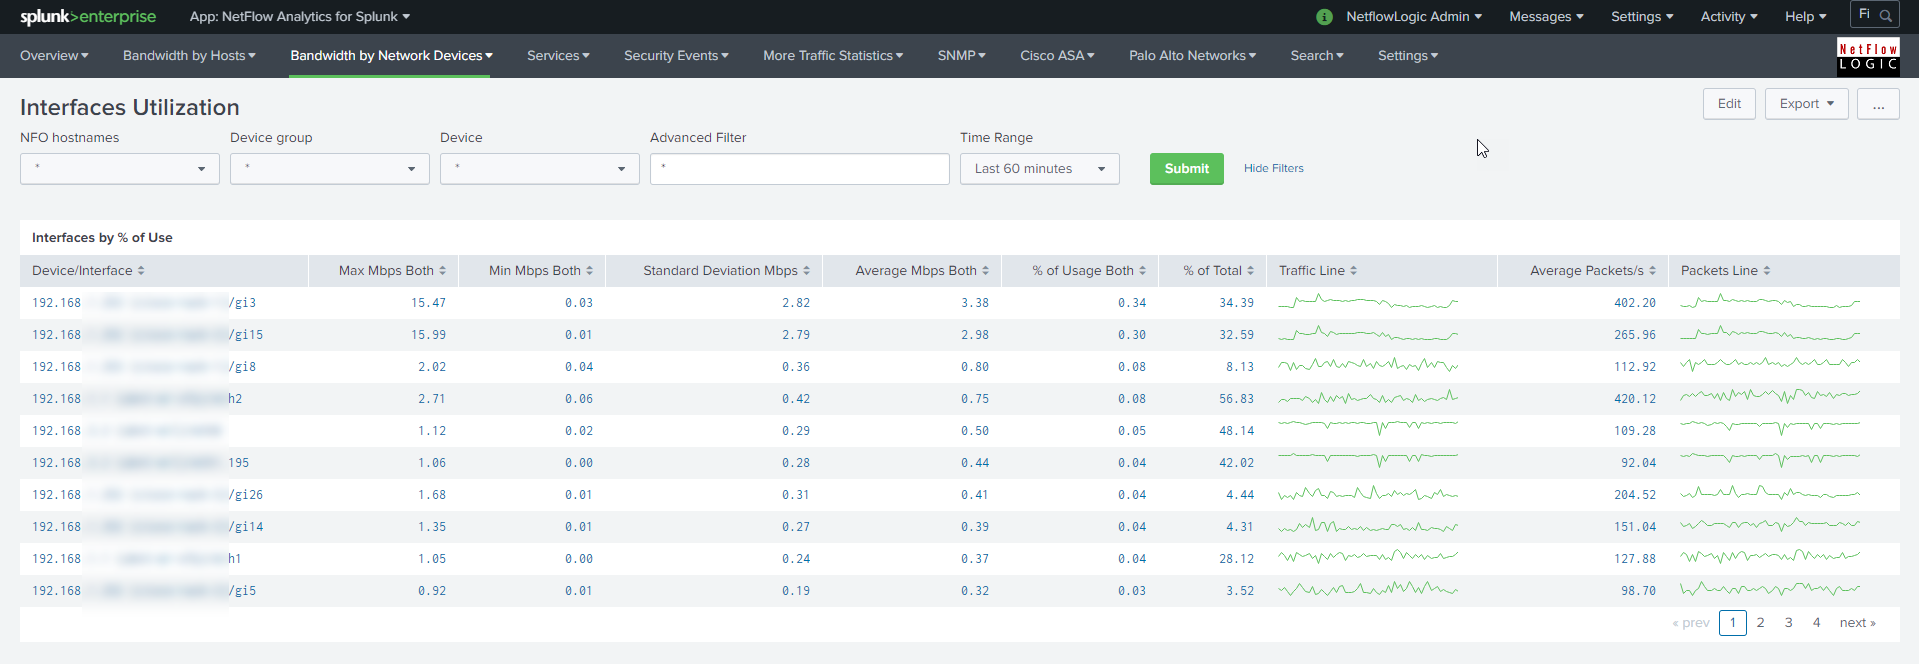
Interfaces Utilization Dashboard
The Interfaces Utilization dashboard shows interfaces across your entire data center, with most loaded interfaces first. As in Top Devices dashboards, Interfaces Utilization allows drill down to examine traffic details going over the selected interface. Click on an interface, and panels below will show traffic speed statistics, and hosts communicating over the selected interface.
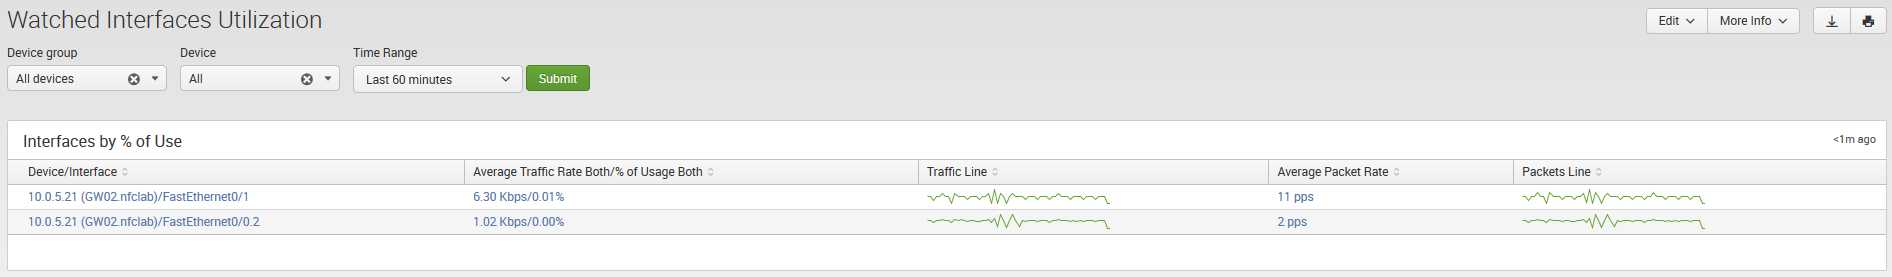
Watched Interfaces Utilization Dashboard
The Watched Interfaces Utilization dashboard is very similar to Interface Utilization, but shows only the interfaces specified in watched-interfaces.csv lookup CSV file. Please see Watched Interfaces section at the bottom of App’s Settings > Configuration page for more details.
Interface Groups Dashboard
This dashboard shows consolidated information for Interface Groups. Interface Groups are defined in interface-groups.csv lookup CSV file. Please see Interface Groups section at the bottom of App’s Settings > Configuration page for more details.
