Applications
Applications dashboards enable users to monitor performance and traffic statistics of applications and selected services in your datacenter. You need to enable corresponding NFO Modules in order to see data in these dashboards.
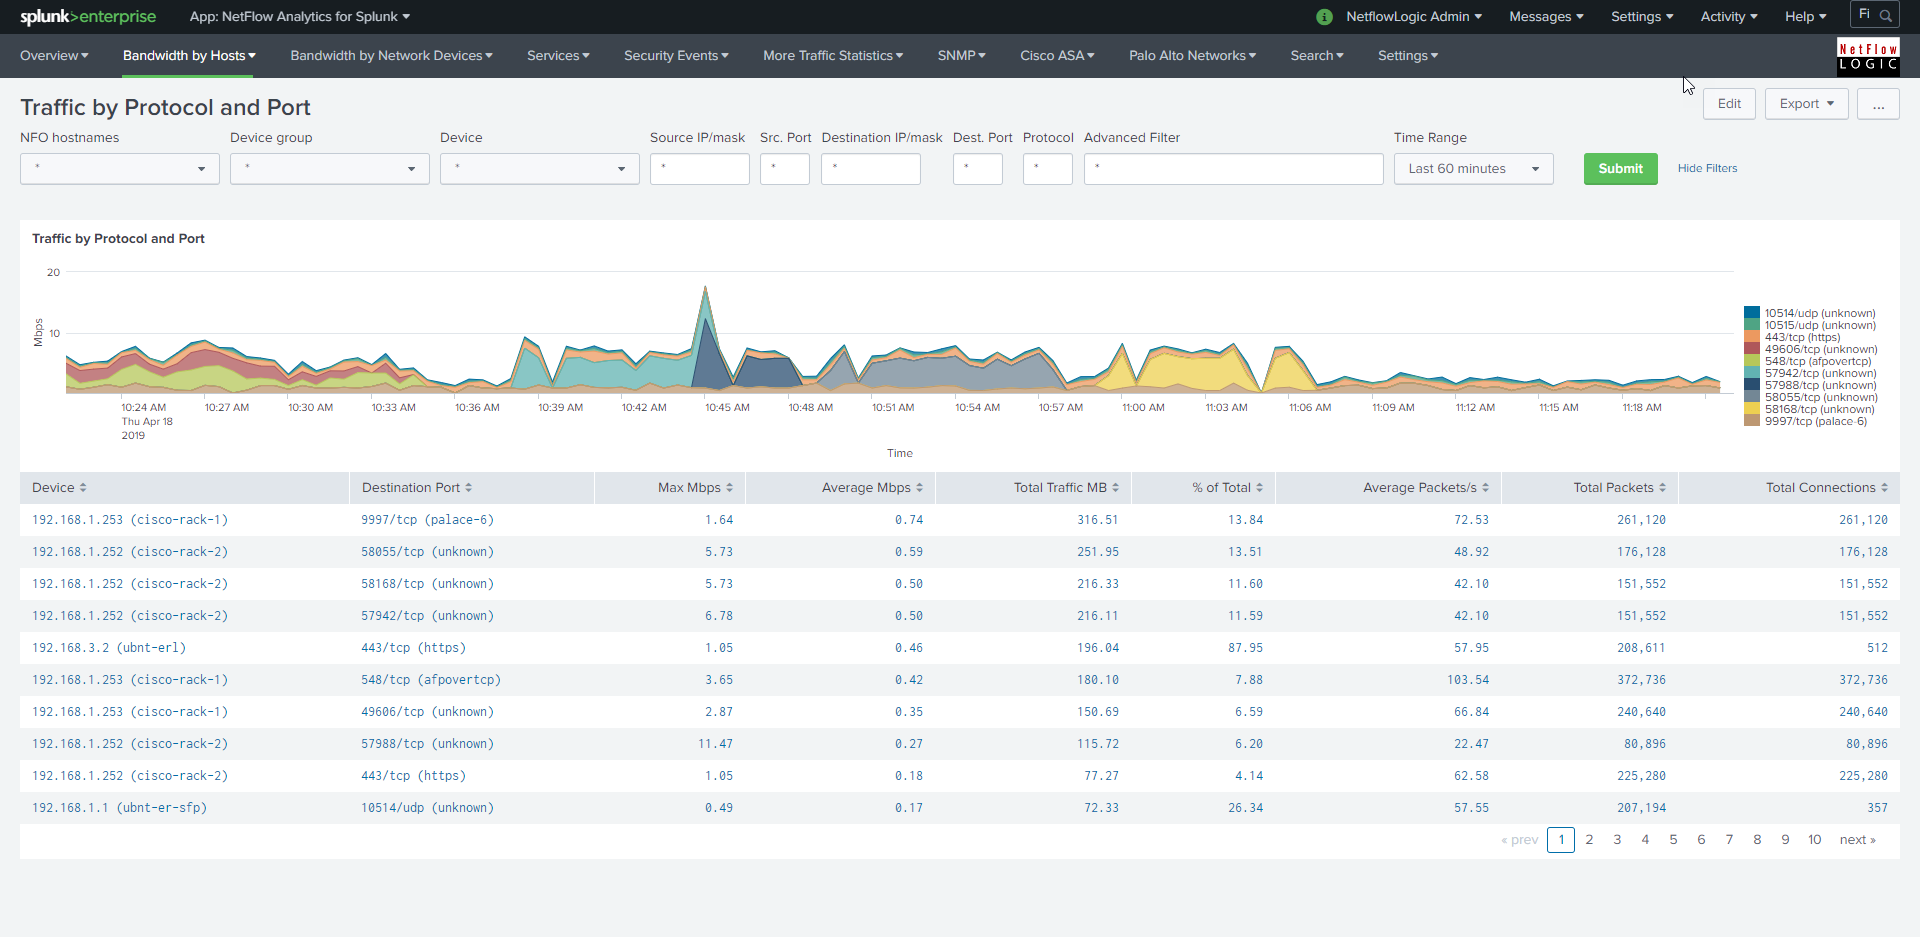
Traffic by Protocol and Port
The Traffic by Protocol and Port dashboard monitors traffic in your network by Service Name and Transport Protocol Port Number (a.k.a Destination port). The App is packaged with services.csv lookup file, which is used to display the service name and protocol, according to IANA: (http://www.iana.org/assignments/service-names-port-numbers/service-names-port-numbers.xhtml).
Service Response Time dashboard
To see data in this dashboard enable and configure Module 10017: Service Performance Monitor. Please refer to NetFlow Optimizer User Guide for details. Use Watch List parameter in this Module to specify the services you want to monitor (Service Destination IP, Destination Port, and Transport protocol).
Palo Alto Top Applications
This dashboard monitors traffic by Application as identified by Palo Alto Network devices. It is useful for real time or historical network utilization and bandwidth monitoring. The dashboard shows traffic volume and connections attributed to each application recognized by Palo Alto Networks devices.
Use the filtering options and time picker at the top of the dashboard to select the time interval and narrow down your search results.
Palo Alto Top Applications and Users
This dashboard monitors traffic by Application and Users as identified by Palo Alto Network devices. It is useful for real time or historical network utilization and bandwidth monitoring. The dashboard shows traffic volume and connections attributed to each application recognized by Palo Alto Networks devices, and allows to drill down to see users of each reported application.
Use the filtering options and time picker at the top of the dashboard to select the time interval and narrow down your search results.
Cisco AVC Top Applications
This dashboard monitors traffic by Application as identified by Network devices reporting Cisco Application Visibility and Control (AVC) flows. It is useful for real time or historical network utilization and bandwidth monitoring. The dashboard shows traffic volume and connections attributed to each application recognized by Cisco AVC technology.
Use the filtering options and time picker at the top of the dashboard to select the time interval and narrow down your search results.
Cisco AVC Top Applications and Users
This dashboard monitors traffic by Application and Users as identified by Network devices reporting Cisco Application Visibility and Control (AVC) flows. It is useful for real time or historical network utilization and bandwidth monitoring. The dashboard shows traffic volume and connections attributed to each application recognized by Cisco AVC technology, and allows to drill down to see users of each reported application.
Use the filtering options and time picker at the top of the dashboard to select the time interval and narrow down your search results.