Security
Cyber Threat Statistics Dashboard
The Cyber Threat Statistics dashboard enables your organization to analyze and prioritize network security event traffic. Using this dashboard you will be able to see geo location of top hosts, network traffic to and from known suspicious hosts. Out of the box we support geo county database from MaxMind and threat intelligence from Emerging Threats and Alienvault. A corporation can also integrate its own watch-list.
To see data in this dashboard enable Security Module Set: 10040, 10050, 10051, 10052, 10053 and install and setup the four utilities for each Module, create the required data sets and add them to the NetFlow Optimizer Modules.

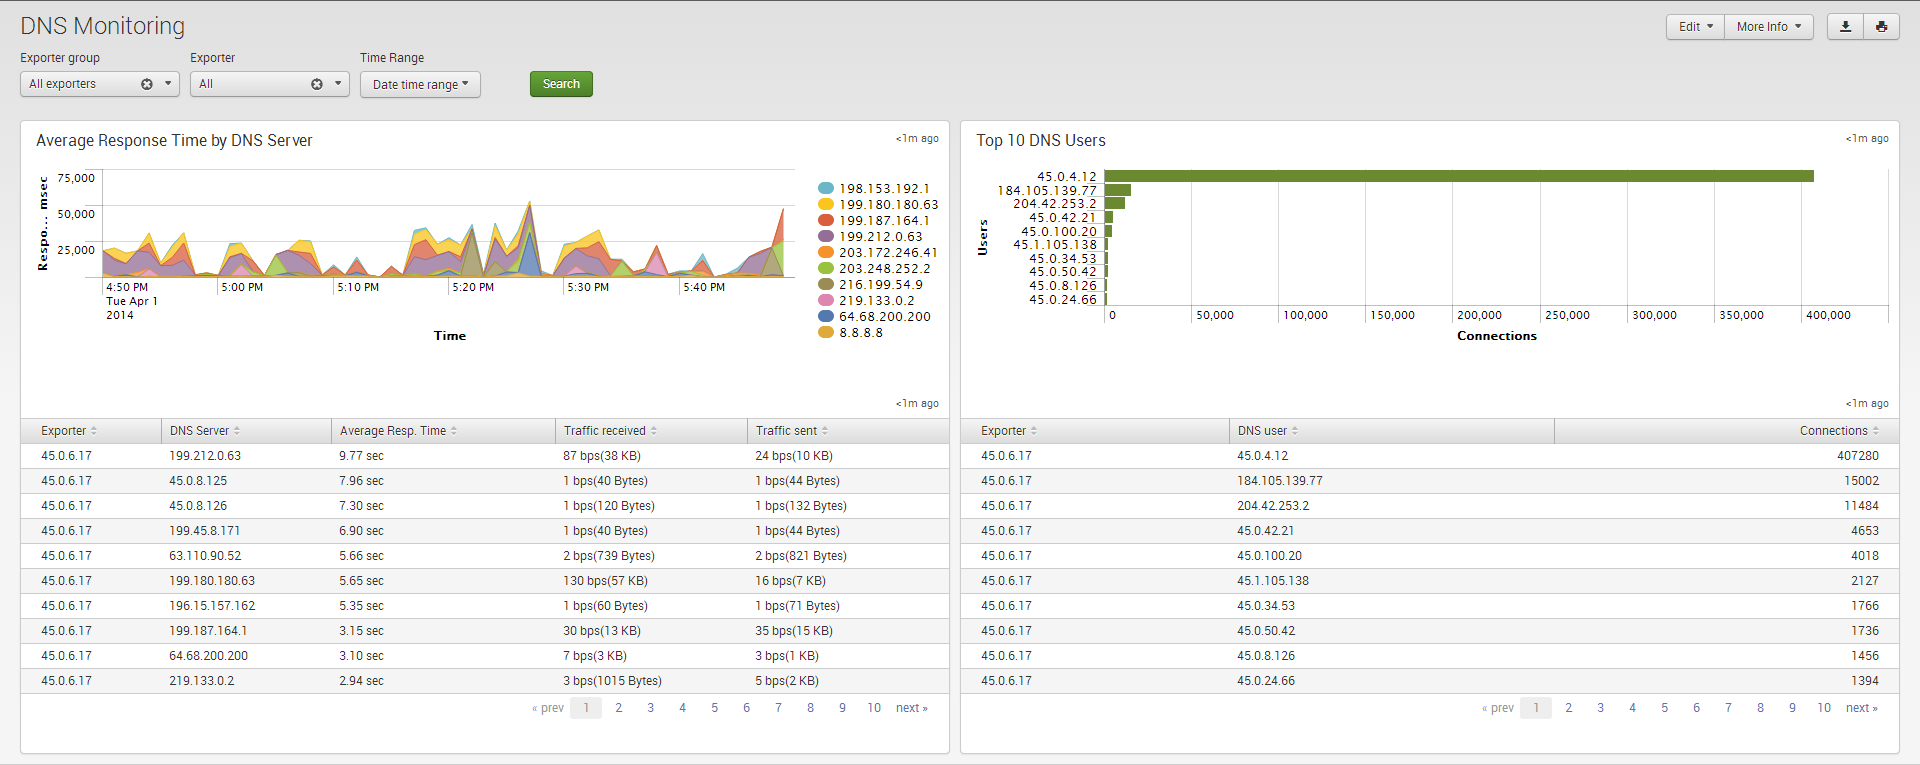
DNS Security Dashboard
To see data in this dashboard enable Module 10004: DNS Monitor. Please refer to NetFlow Optimizer User Guide for details. It is useful to monitor average response time of all DNS servers used in your network. The right panel also shows top DNS users.
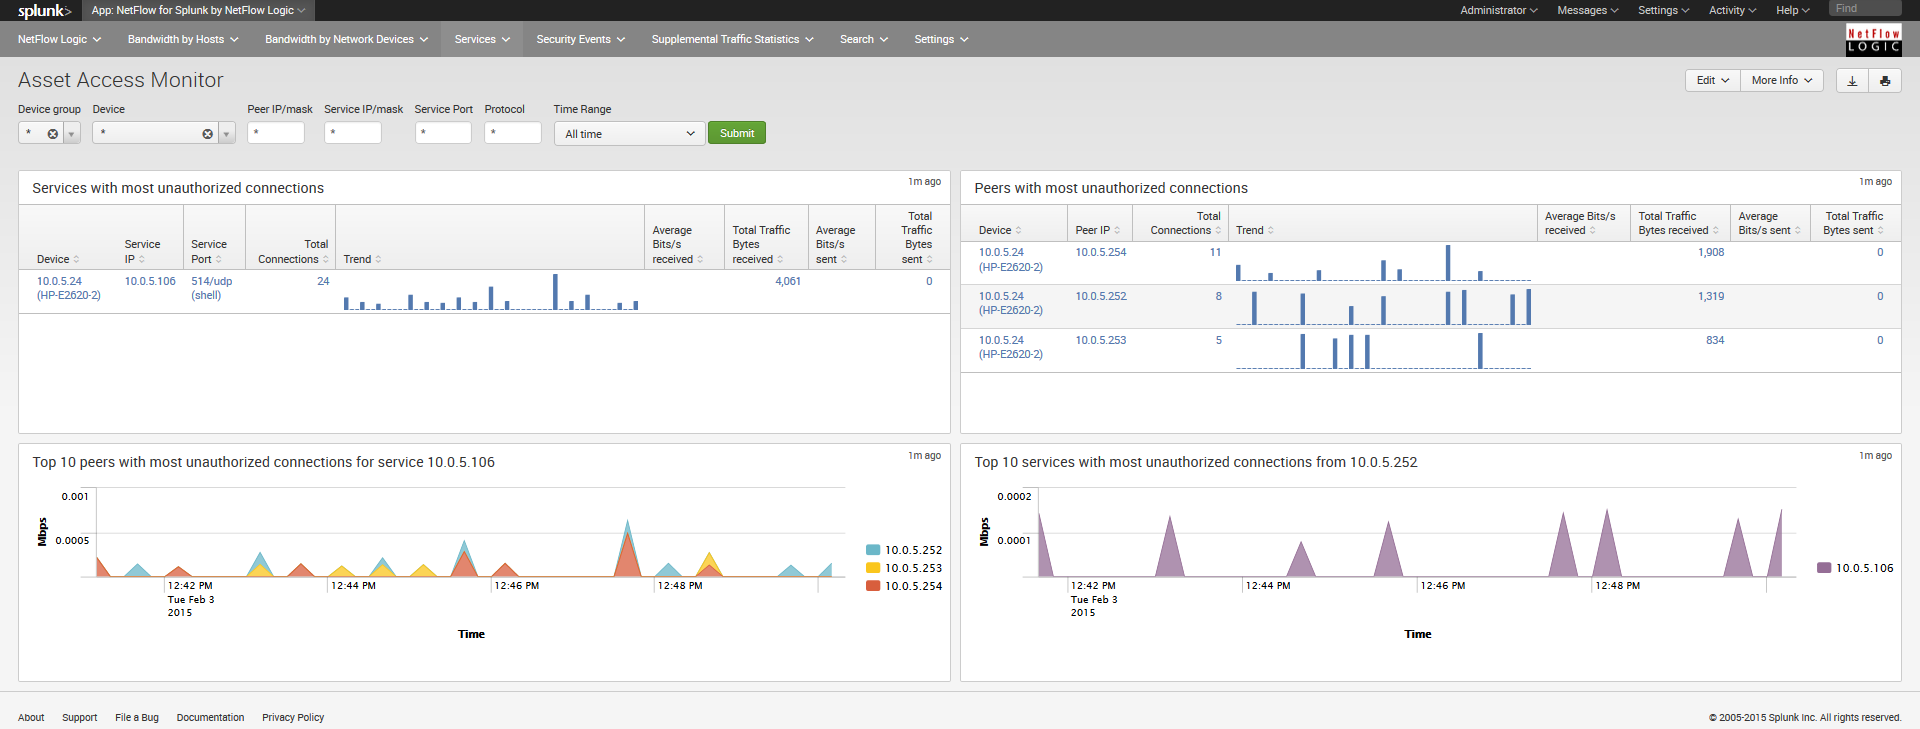
Asset Access Monitor
To see data in this dashboard enable and configure Module 10014: Asset Access Monitor. Please refer to NetFlow Optimizer User Guide for details.
This dashboard shows top services with most unauthorized connections - traffic from unauthorized users to services (IP address, destination port, protocol configured in the NFO Module 10014: Asset Access Monitor) and top peers with most unauthorized connections – traffic to peers (IP address and subnet mask also configurable in NFO Module 10014 section).
Traffic Using Critical Ports
To see data in this dashboard enable Module 10062: Network Conversations Monitor. Please refer to NetFlow Optimizer User Guide for details. On Splunk side configure critical_ports.csv lookup.
This dashboard shows DNS traffic (top panels), and traffic over critical ports (e.g. 21(ftp), 22(ssh), 23(telnet), 25(smtp), 50(re-mail-ck), 51(la-maint), 67(bootps), 68(bootpc), 115(sftp), 123(ntp), etc.). Details include comunicating pairs, bytes sent, bytes received, and flow count.

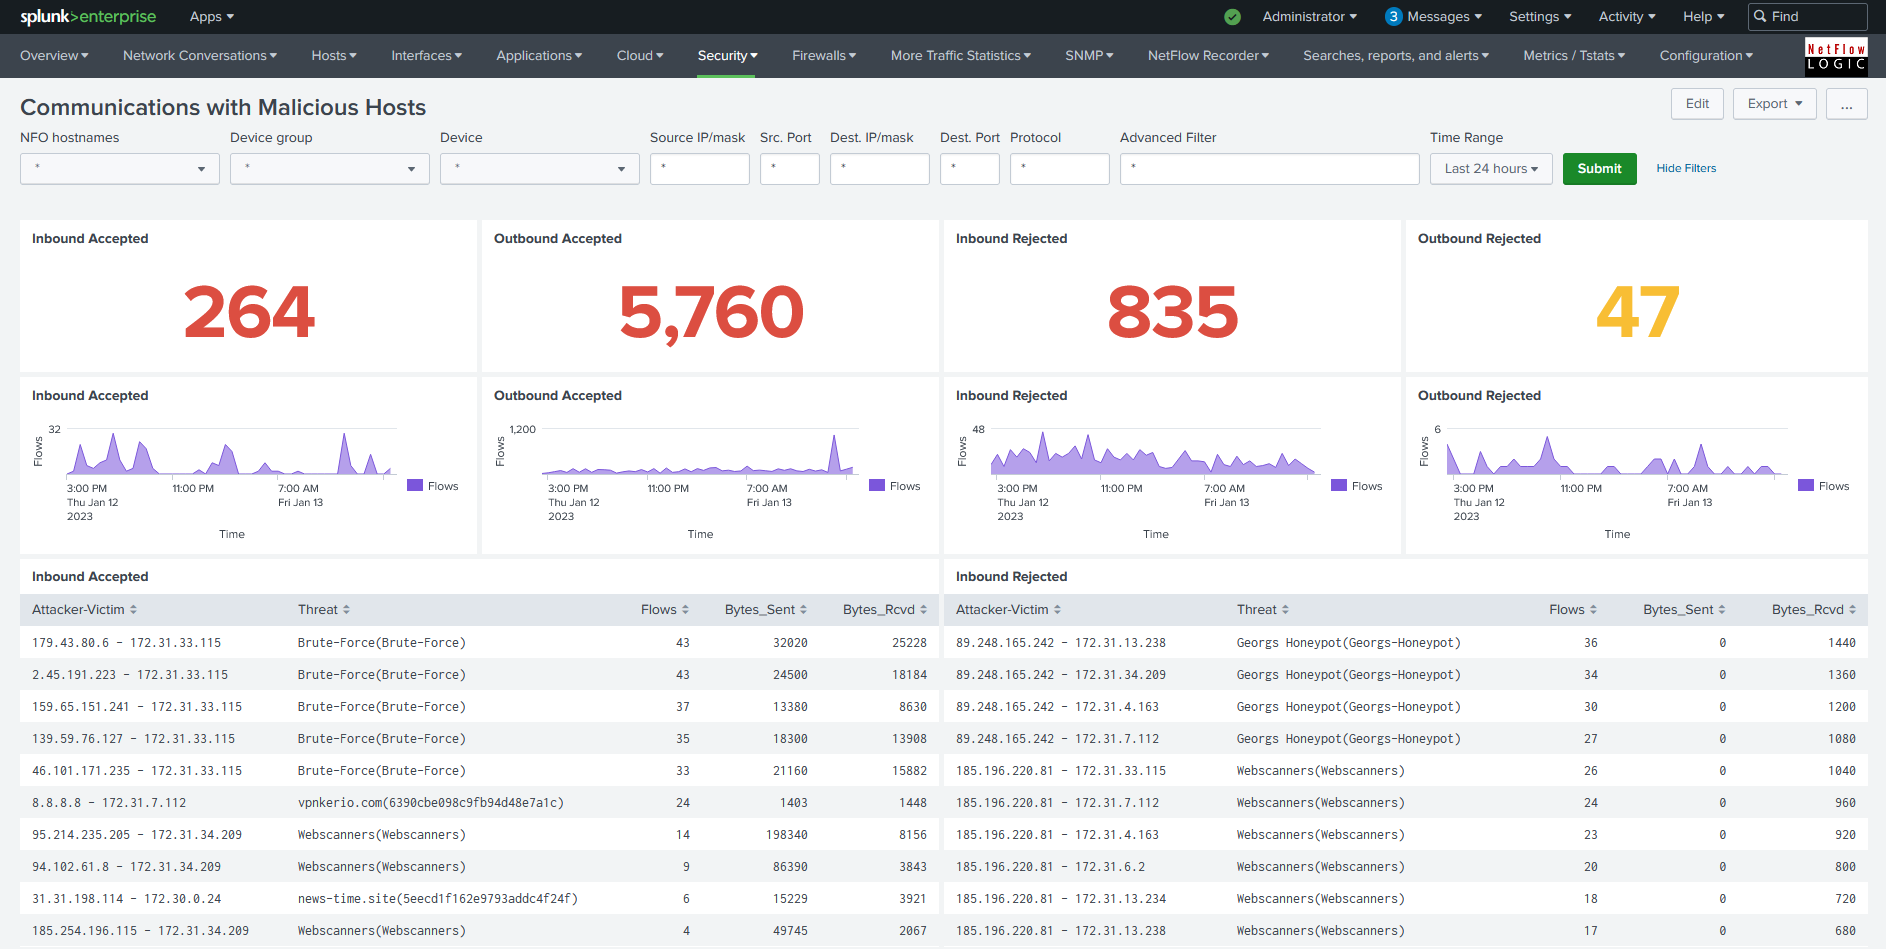
Communications with Malicious Hosts
To see data in this dashboard enable Module 10062: Network Conversations Monitor, and configure integration with various threat lists. Please refer to NetFlow Optimizer User Guide for details.
This dashboard shows counts of Accepted/Rejected Inbound/Outbound events as well as details such as attacker and victim IP addresses, reputation, traffic volume and flow count.